x402 Market Unfairness Report


Executive Summary and Core Claims
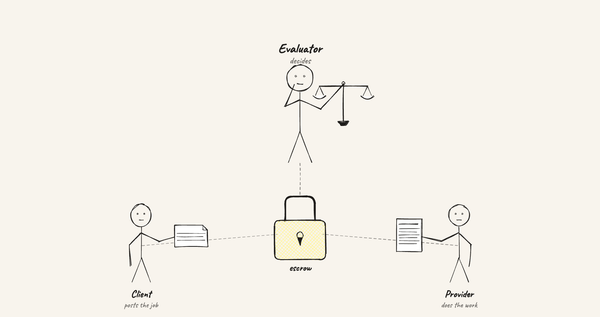
AI agents now buy what they need on their own — data, compute, model calls — and pay for it without a human approving each purchase. Any service can switch it on at its API endpoint and start selling to agents the same day.
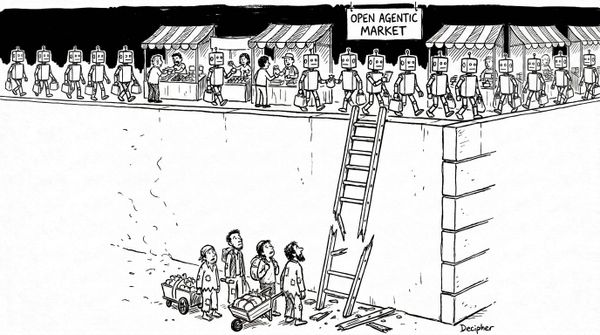
Agents buying and merchants selling adds up to a marketplace. In other words, x402 has enabled a new kind of marketplace. This is a marketplace where the buyers are machines that cannot be lured with advertisements, marketing campaigns, or brands. They have very specific requirements and a budget, and they purchase exactly what is needed in seconds. This is a market where it is extremely hard to sell to this new type of buyer.
The x402 market has already been studied. Researchers and analysts have measured how much of its volume is real vs how much is wash trading. Chain-analytics firms have counted the agents, the transactions and the dollars moving through it. Security researchers have mapped how the rails can be attacked, one of them showing that a discovery index can be gamed into recommending a malicious endpoint.
However, most research on x402 looks at the market from the buyer's or the network’s side. Few look at it from the merchant’s side.
What this report is
This report analyzes open x402 marketplaces from the seller’s perspective. It examines how x402 discovery indices decide which merchants an agent ( the buyer ) discovers, and which merchants are left out.
The audit covers all 2,252 merchants in the CDP Bazaar catalog, from a snapshot taken on 9 September 2026, over 30 days of activity.
Why this report matters?
As previously stated, the buyers in this market are unique. They don’t browse or watch ads to decide who to buy from.
An agent simply relies on a discovery index for a service, reads a short ranked list provided by the index, and buys from the top few merchants that best fit its needs and budget.
There is no second page, window shopping or brand recall. Whoever sits at the top of that list gets the sale. Everyone below it is not competing on worse terms. They are not competing at all.
Core Findings of this research:
- The major x402 discovery indexes (CDP Bazaar, x402scan, AgentCash) rank merchants mainly on sales volume and unique buyers. New merchants have neither, so they are rarely shown to agents.
- Sales are highly uneven in every category examined (Gini 0.74–0.98). In Data & Enrichment, the top three merchants take more than 9 of every 10 payments.
- Rank of a merchant is decided by sales history, not by service quality or uniqueness. Sales volume and buyer count explain 47–74% of the score gap between top- and bottom-ranked merchants. Service reliability explains none of it.
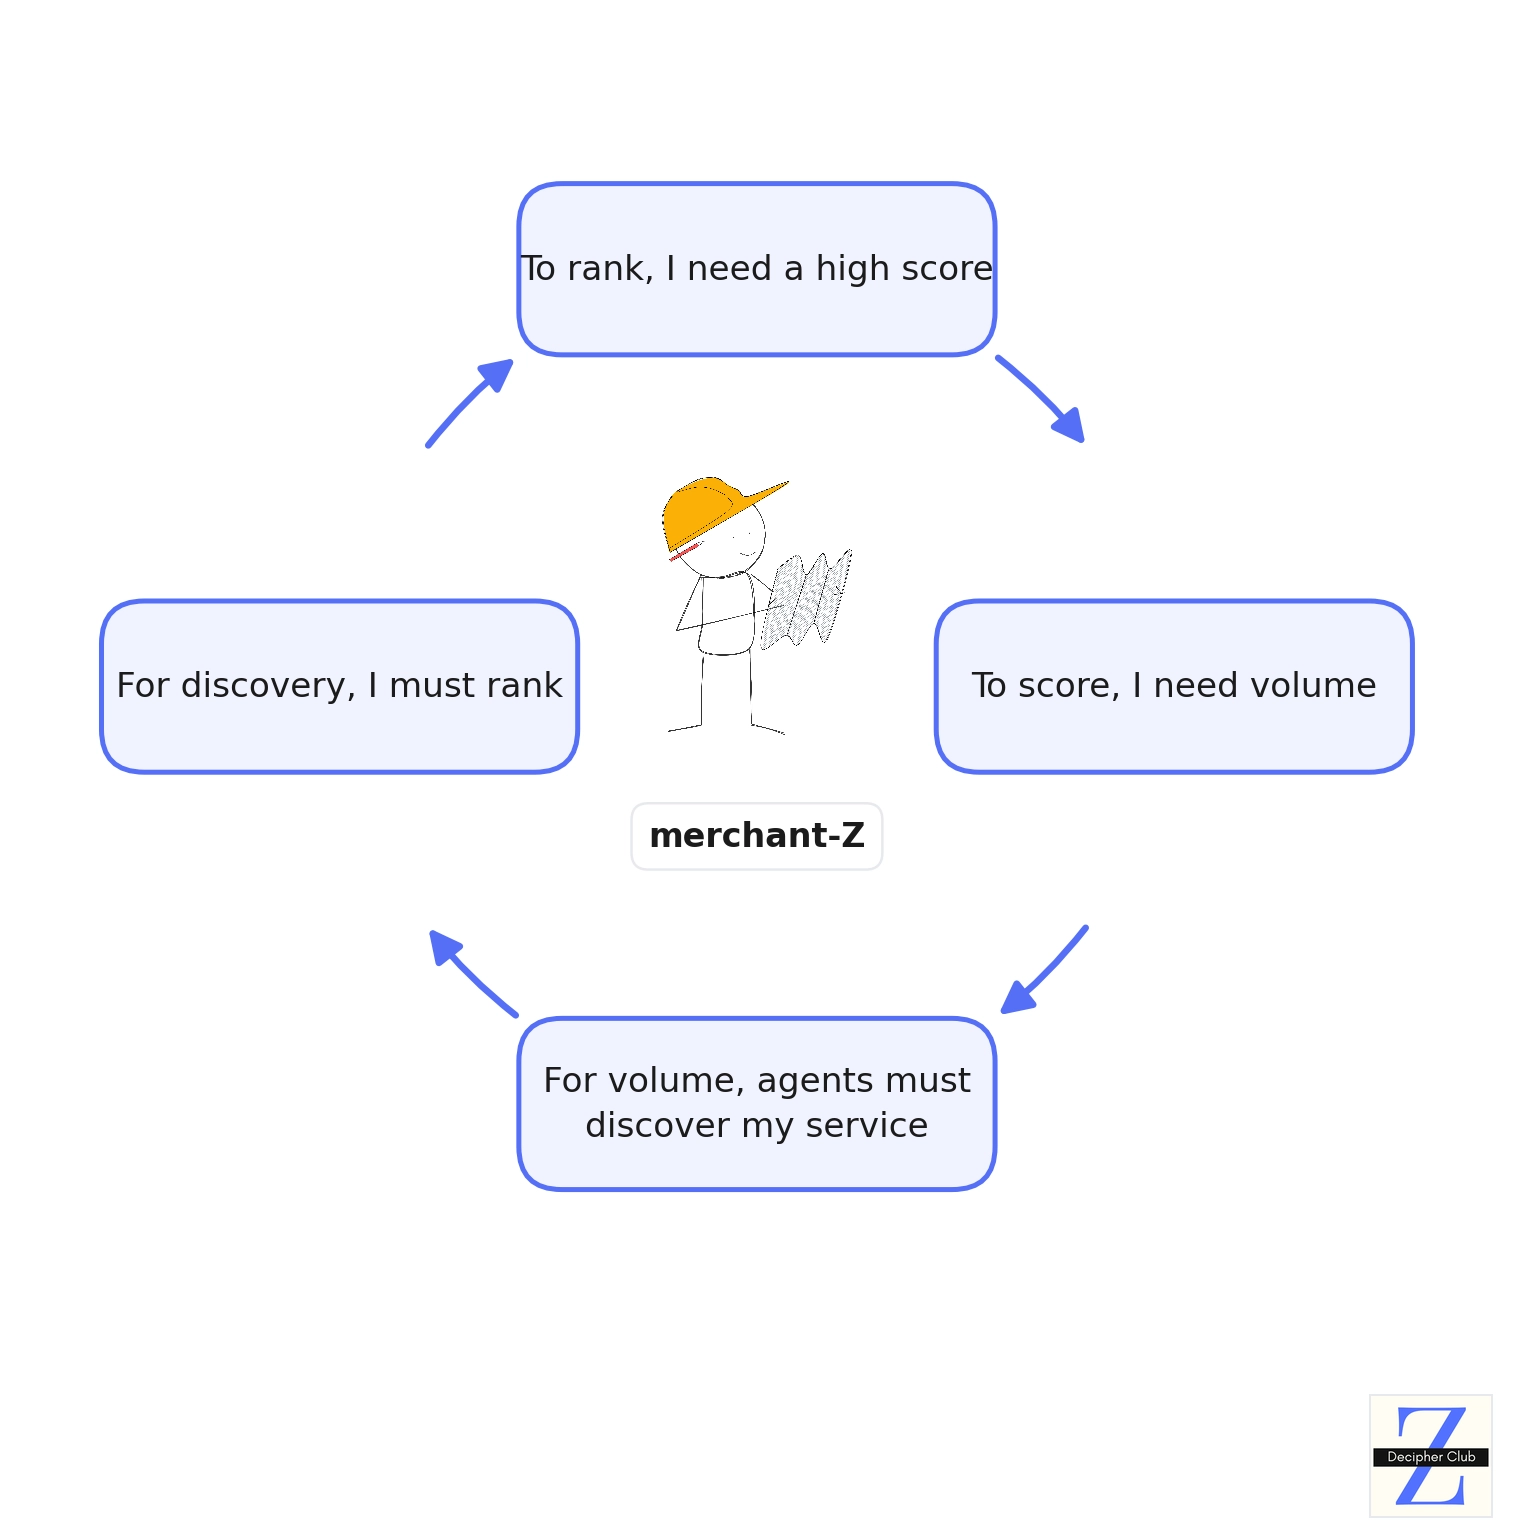
- Most merchants are in a cyclical loop.
- They don’t have volume because they can’t rank high enough for agents to choose them.
- They can’t rank high because they don’t have the volume needed to be ranked.
The report also proposes solutions in three groups:
- Fair first chance. Reserved slots, an exposure-based head start, and treating missing history as uncertainty rather than a low score, so a new merchant gets shown before it has a sales record.
- Capability-first ranking. Rank on what a merchant can prove today — uptime, schema conformance, correct answers to test calls — instead of past sales.
- Outcome-based discovery. Tie feedback to paid calls, so whether a sale actually worked shapes which merchants the next agent sees.
The goal is not to hand newcomers an advantage. It is to make sure the leaders can be challenged.

1. Introduction
The web was built without a way to pay. HTTP has carried a status code called 402, Payment Required, since its early specifications. It was reserved for a payment system that never arrived. The gap is easiest to see when you observe the payment-specific limitations of the web today.
A reader who reads one article from a newsletter cannot pay a few cents for it directly to the author. The choice is either a monthly subscription or nothing, so most people take a third option and read something free that is funded by advertising. Similarly, a developer who needs a single call to a weather API has the same problem in a different shape: create an account, add a card, generate a key, all for a request worth a fraction of a cent.
The web moves the article and the data instantly. However, it has no way to move money alongside them.
The reason was arithmetic. Card payments carried fixed fees of tens of cents, so a one-cent charge cost more to process than it was worth. The web found other ways to pay for itself — advertising, subscriptions, accounts — and 402 status code was unused for nearly 3 decades.
x402 switches that status code on.
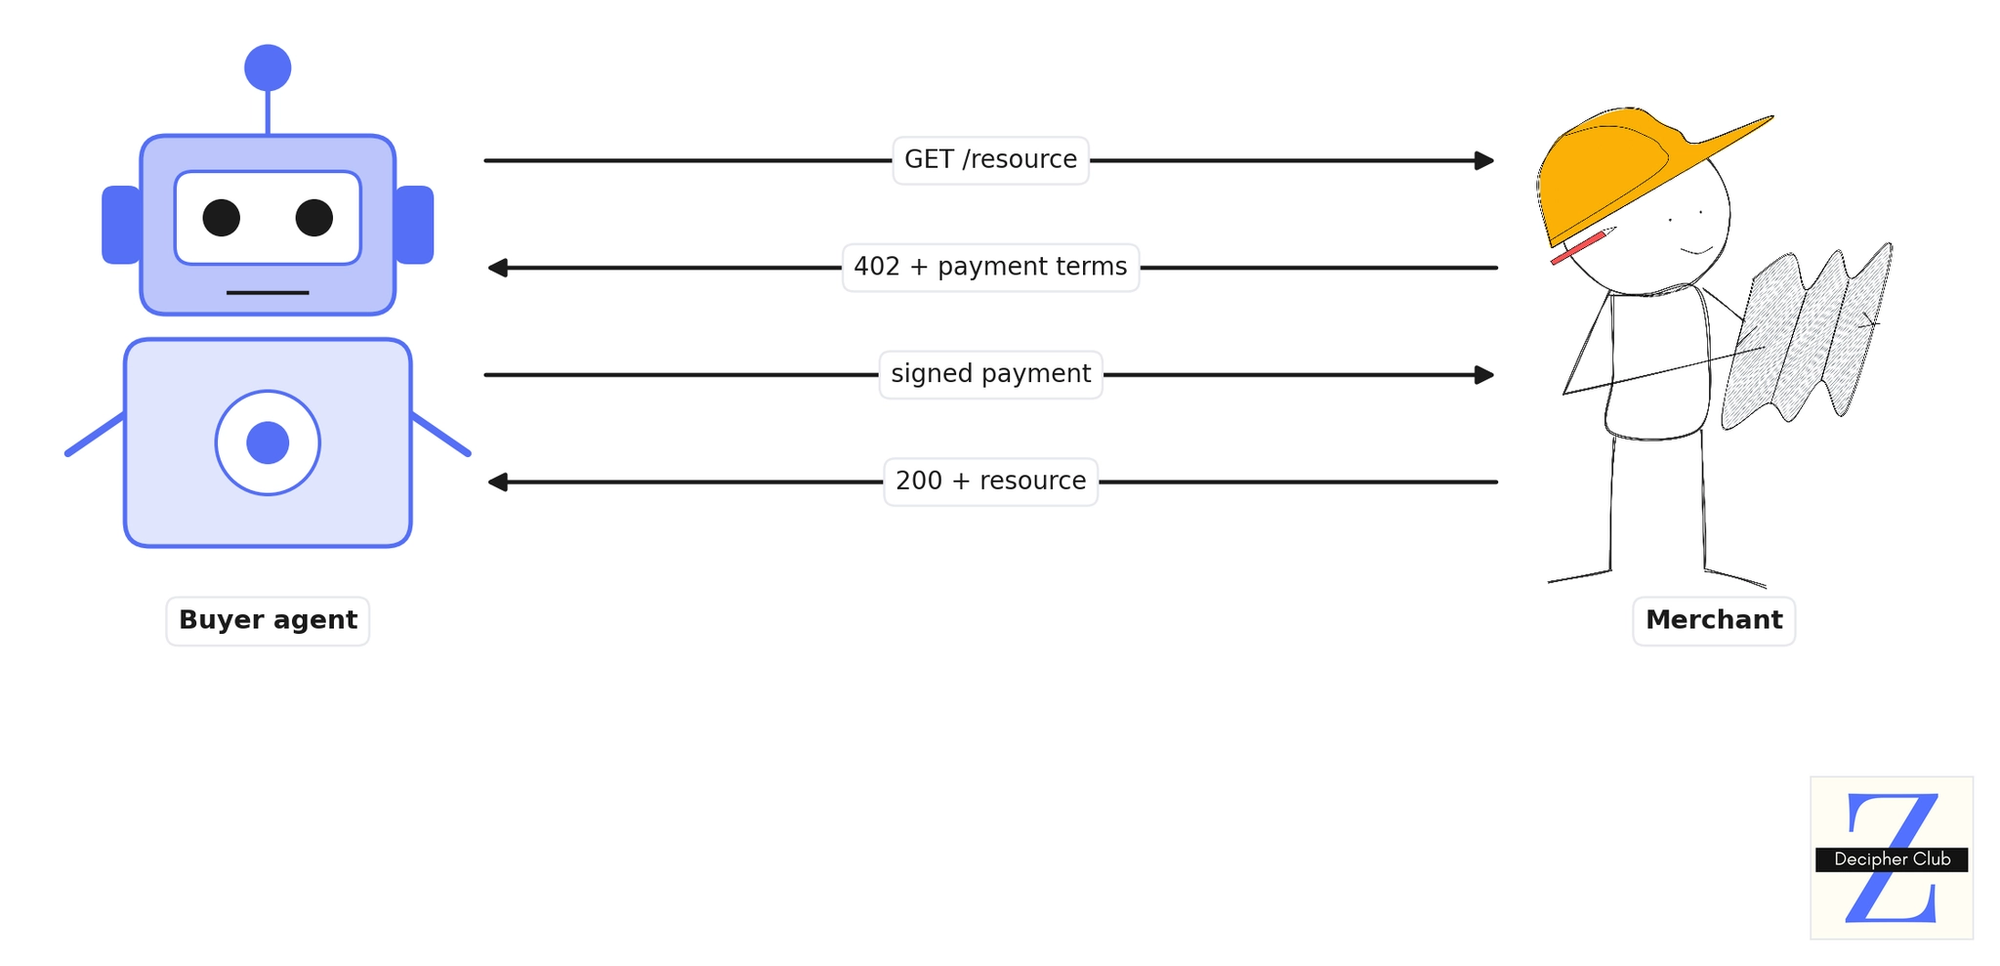
x402 is an open standard that uses 402 status code for the job it was reserved for.
- A client asks a server for a particular service - “let’s say to find best research papers on blockchains.”
- The server replies 402 and attaches its terms:
- the price,
- the payment method it accepts,
- the network,
- and the address to pay.
- The client signs a payment and asks again.
- The server checks the payment and returns the resource.
Nothing in that exchange needs an account, an API key, a subscription, or a person. Additionally, stablecoins settle for a fraction of a cent, so a one-cent sale is finally worth making.
1.1 The Inception of Open Agentic Commerce
The x402 innovation creates a market where the buyer is software.
Two main roles fall out of it - an agent ( the buyer ) and a merchant ( the seller )
- An agent is a program that holds a balance and buys on someone's behalf.
- A merchant is a service that answers x402 and sells access to what it does — a data feed, a model call, a search over company filings.
The result is a marketplace with no storefronts and headless merchants.
Let’s look at this with a simple example.
Bob is a researcher working on niche blockchain topics.
The material he needs is scattered across whitepapers, protocol docs and technical write-ups, and it changes weekly. He delegates the search to BobAgent, an assistant with one job: find and buy what Bob needs.
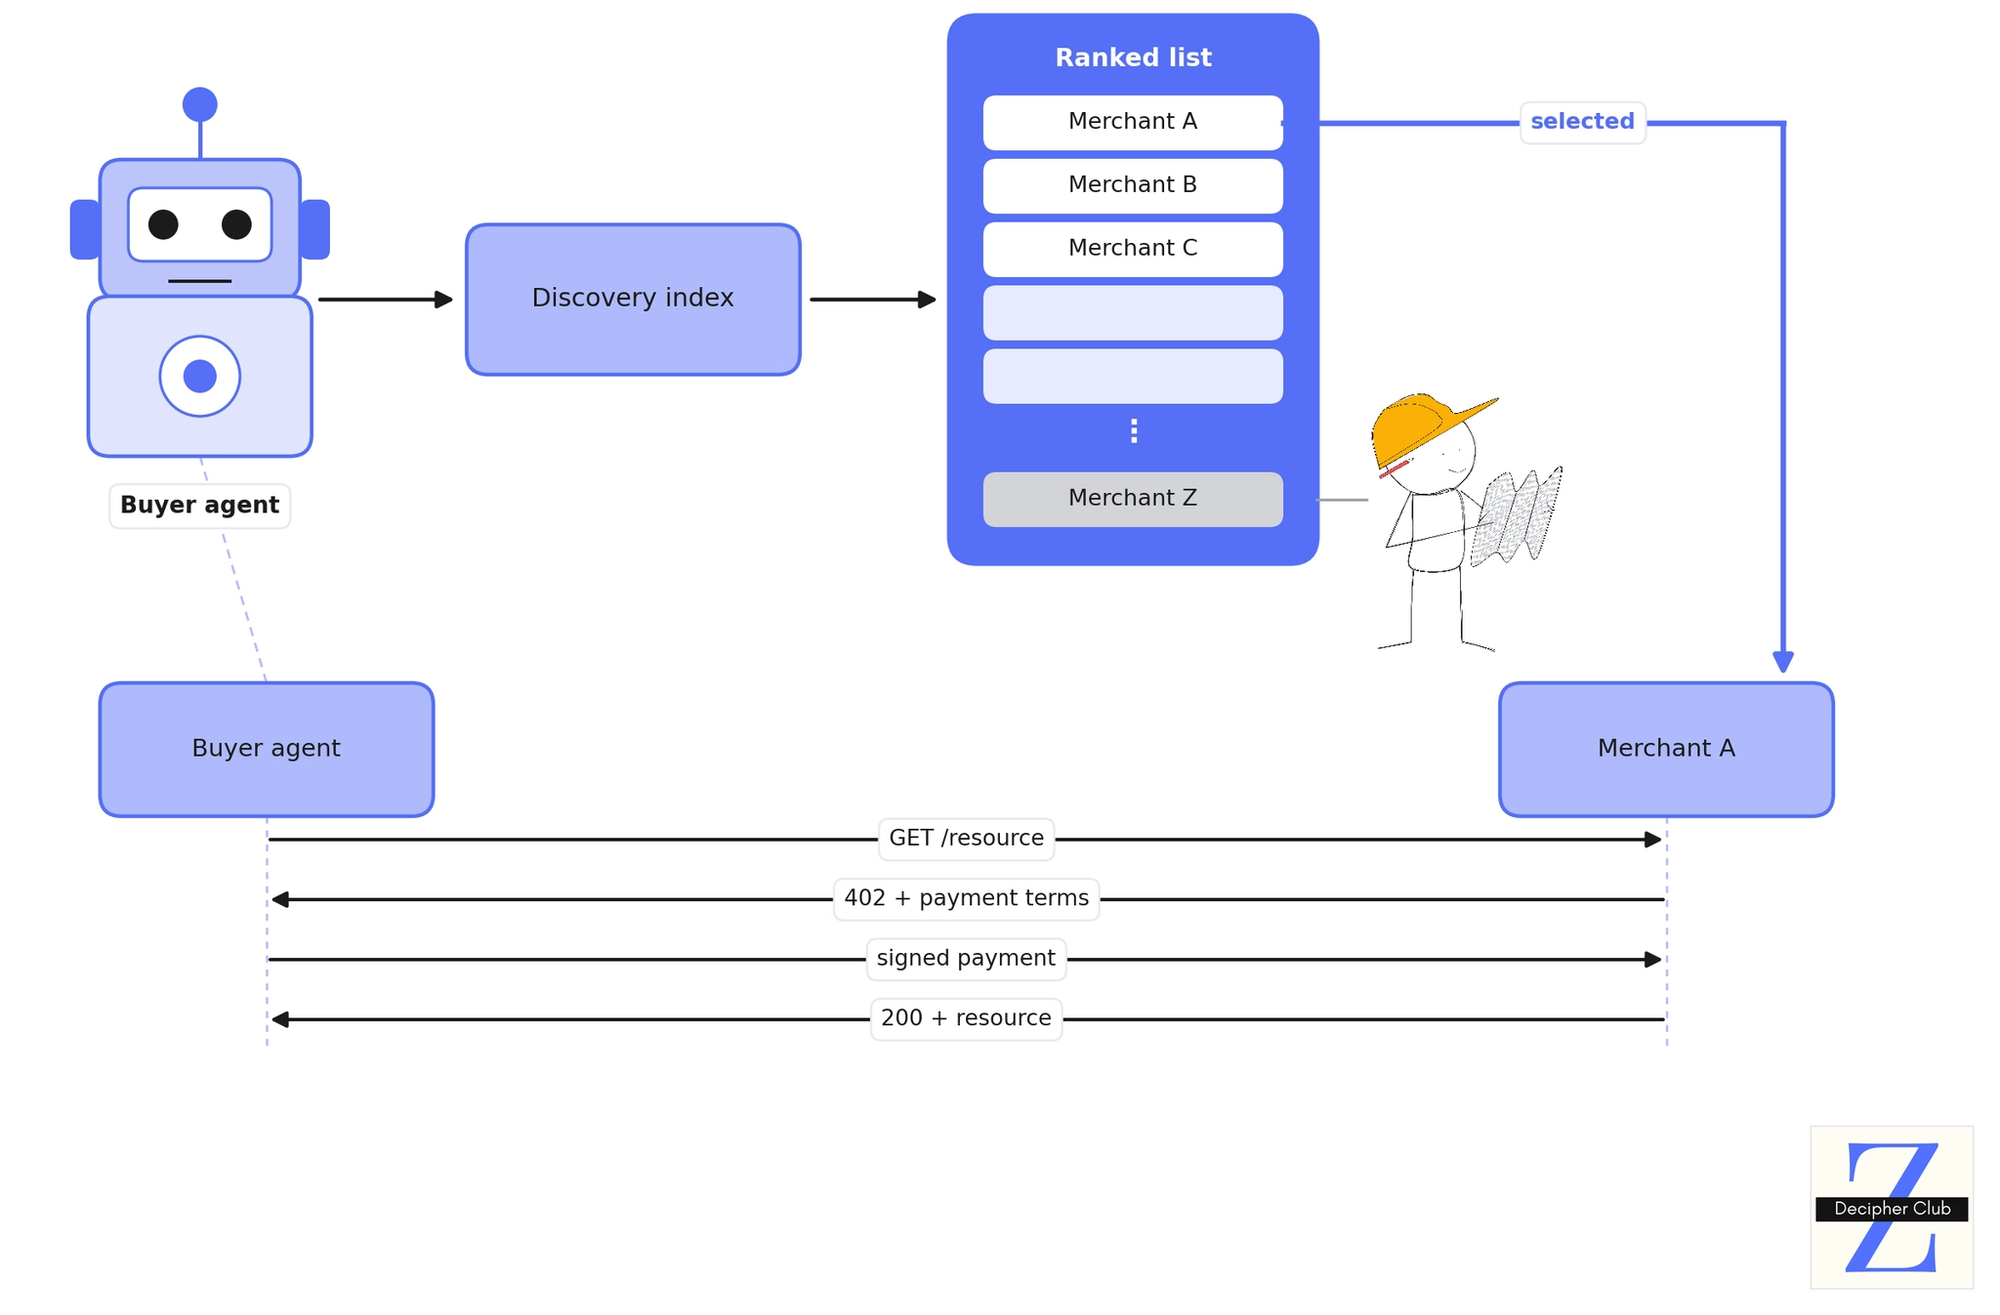
The purchase runs in five steps.
- Bob asks for recent research on a topic.
- BobAgent queries a discovery index for merchants selling that kind of resource.
- The index returns a ranked list.
- BobAgent picks a merchant, pays a few cents, and receives the file.
- Bob gets the research.
2. The Root of All Problems: How Agents Pick Merchants to Buy From
This section establishes the mechanism the rest of the report measures and reveals.
Let’s go back to the example of Bob and his agent.
When Bob’s agent was tasked to search for and fetch the required papers, it did not browse, compare, or review marketing for various services. Bob’s agent knows exactly what it needs and has a budget. It reads a ranked list provided by discovery indices, takes the first best fit from the top and makes the purchase. It should be noted that the ranked order of merchants provided by the index is all the buyer agent can see and buy from.
Therefore, this ranking order of merchants is worth understanding. It is crucial to understand:
- what mechanics decide the order
- what influences the order
- how a new merchant gets ranked
- and whether a new merchant ever reaches the top
2.1 An x402 Purchase…but from the Merchant’s perspective
Now for the same purchase of Bob’s agent, let’s understand the procedure from the seller's perspective.
Let’s say this particular category of “technical resource gathering” has 4 established incumbent merchants — A, B, C, and D. Each of them already has months of settled transactions.
A new merchant Z enters this category. Z offers an equivalent service as well as one unique capability the others lack. However, Z has no transaction history, volume or buyer diversity.
Z's operating question is narrow: under what conditions does BobAgent ever see Z?
2.2 How Today's Indexes Rank Merchants
Quick Glance at current discovery indices:
| Index | What determines position |
|---|---|
| CDP Bazaar (Coinbase) | • Query relevance, |
| • then a quality composite: | |
| • 30-day payment count, | |
| • 30-day distinct buyers, | |
| • how recently the service was used, | |
| • completeness of listing metadata, | |
| • and a de-weighting of shared or tunnelled hosts. | |
| Note: A hand-curated partner tier ranks above everything else. | |
| x402scan | • Call count first, |
| • tag count as the tiebreaker. | |
| • Success rate and latency are collected, but only for calls routed through x402scan's own relay. | |
| AgentCash | • Semantic match against the request, |
| • combined with usage signals — transaction count, distinct wallets, volume, last-seen date — at both the endpoint and the origin level. | |
| • Usage by a curated set of trusted wallets is weighted more heavily. |
As clearly observed, in the major discovery indices today, merchants are ranked mainly on two criteria:
- total volume of sales
- unique buyers they have sold to,
Every index counts both. x402scan is the clearest case, because its sort order is readable rather than guessed at: it lists merchants by call count, highest first.
Every other criterion such as completeness of listing information, recency of sales, count of relevant tags — sits below the volume and buyer diversity criteria. None of them is strong enough to boost a new merchant’s ordering w.r.t an existing one.
1. Unranked Catalog: this catalog is fully exportable.
GET /platform/v2/x402/discovery/resources accepts offset and a limit of up to 1,000, and reports pagination.total — 15,725 resources when checked on 2026-09-18.2. Ranked Catalog: The ranked view is capped at 20 and cannot be paged.
GET /platform/v2/x402/discovery/search rejects any limit above 20 outright. And it silently ignores offset — for example, requesting offset=3 returns exactly the same first three results as no offset at all.So a merchant ranked 21st for a query is not merely scrolled past. It cannot be returned at all.
The response an agent receives has no room for it and no mechanism to ask for more. Whoever sits in the top 20 is the entire market the agent can see.
2.3 Two kinds of signal
The ranking inputs fall into two groups that are routinely conflated, and separating them is what makes Z's position legible.
An admission signal determines whether a merchant enters the catalog at all: schema completeness, a natural-language description, service name, tags, and — on CDP — one settled payment, since indexing is triggered by settlement rather than registration.
An ordering signal determines position among merchants already admitted: settled transaction count and distinct buyer count.
The distinction matters because the two are governed by different constraints. Admission signals are controllable on day one and cost nothing. Ordering signals are historical, and cannot be produced by effort alone.
2.4 Merchant Z's position
On entry Z scores zero on both ordering signals. Zero transactions, zero distinct buyers.
That, in isolation, is defensible. A new merchant should not outrank an established one on day one, and some initial period of low placement is a reasonable cost of entry.
The defensible version of Z's path is incremental. Z improves its service, sharpens its description and tags, accumulates a few transactions, and climbs.
Measurement does not support that path. Contrary to the assumption that discovery rewards listing quality, the data shows documentation tracks rank only weakly, and explains little of the gap.
Every merchant in four categories was scored, then split into rank quartiles. Comparing the top quartile against the bottom:
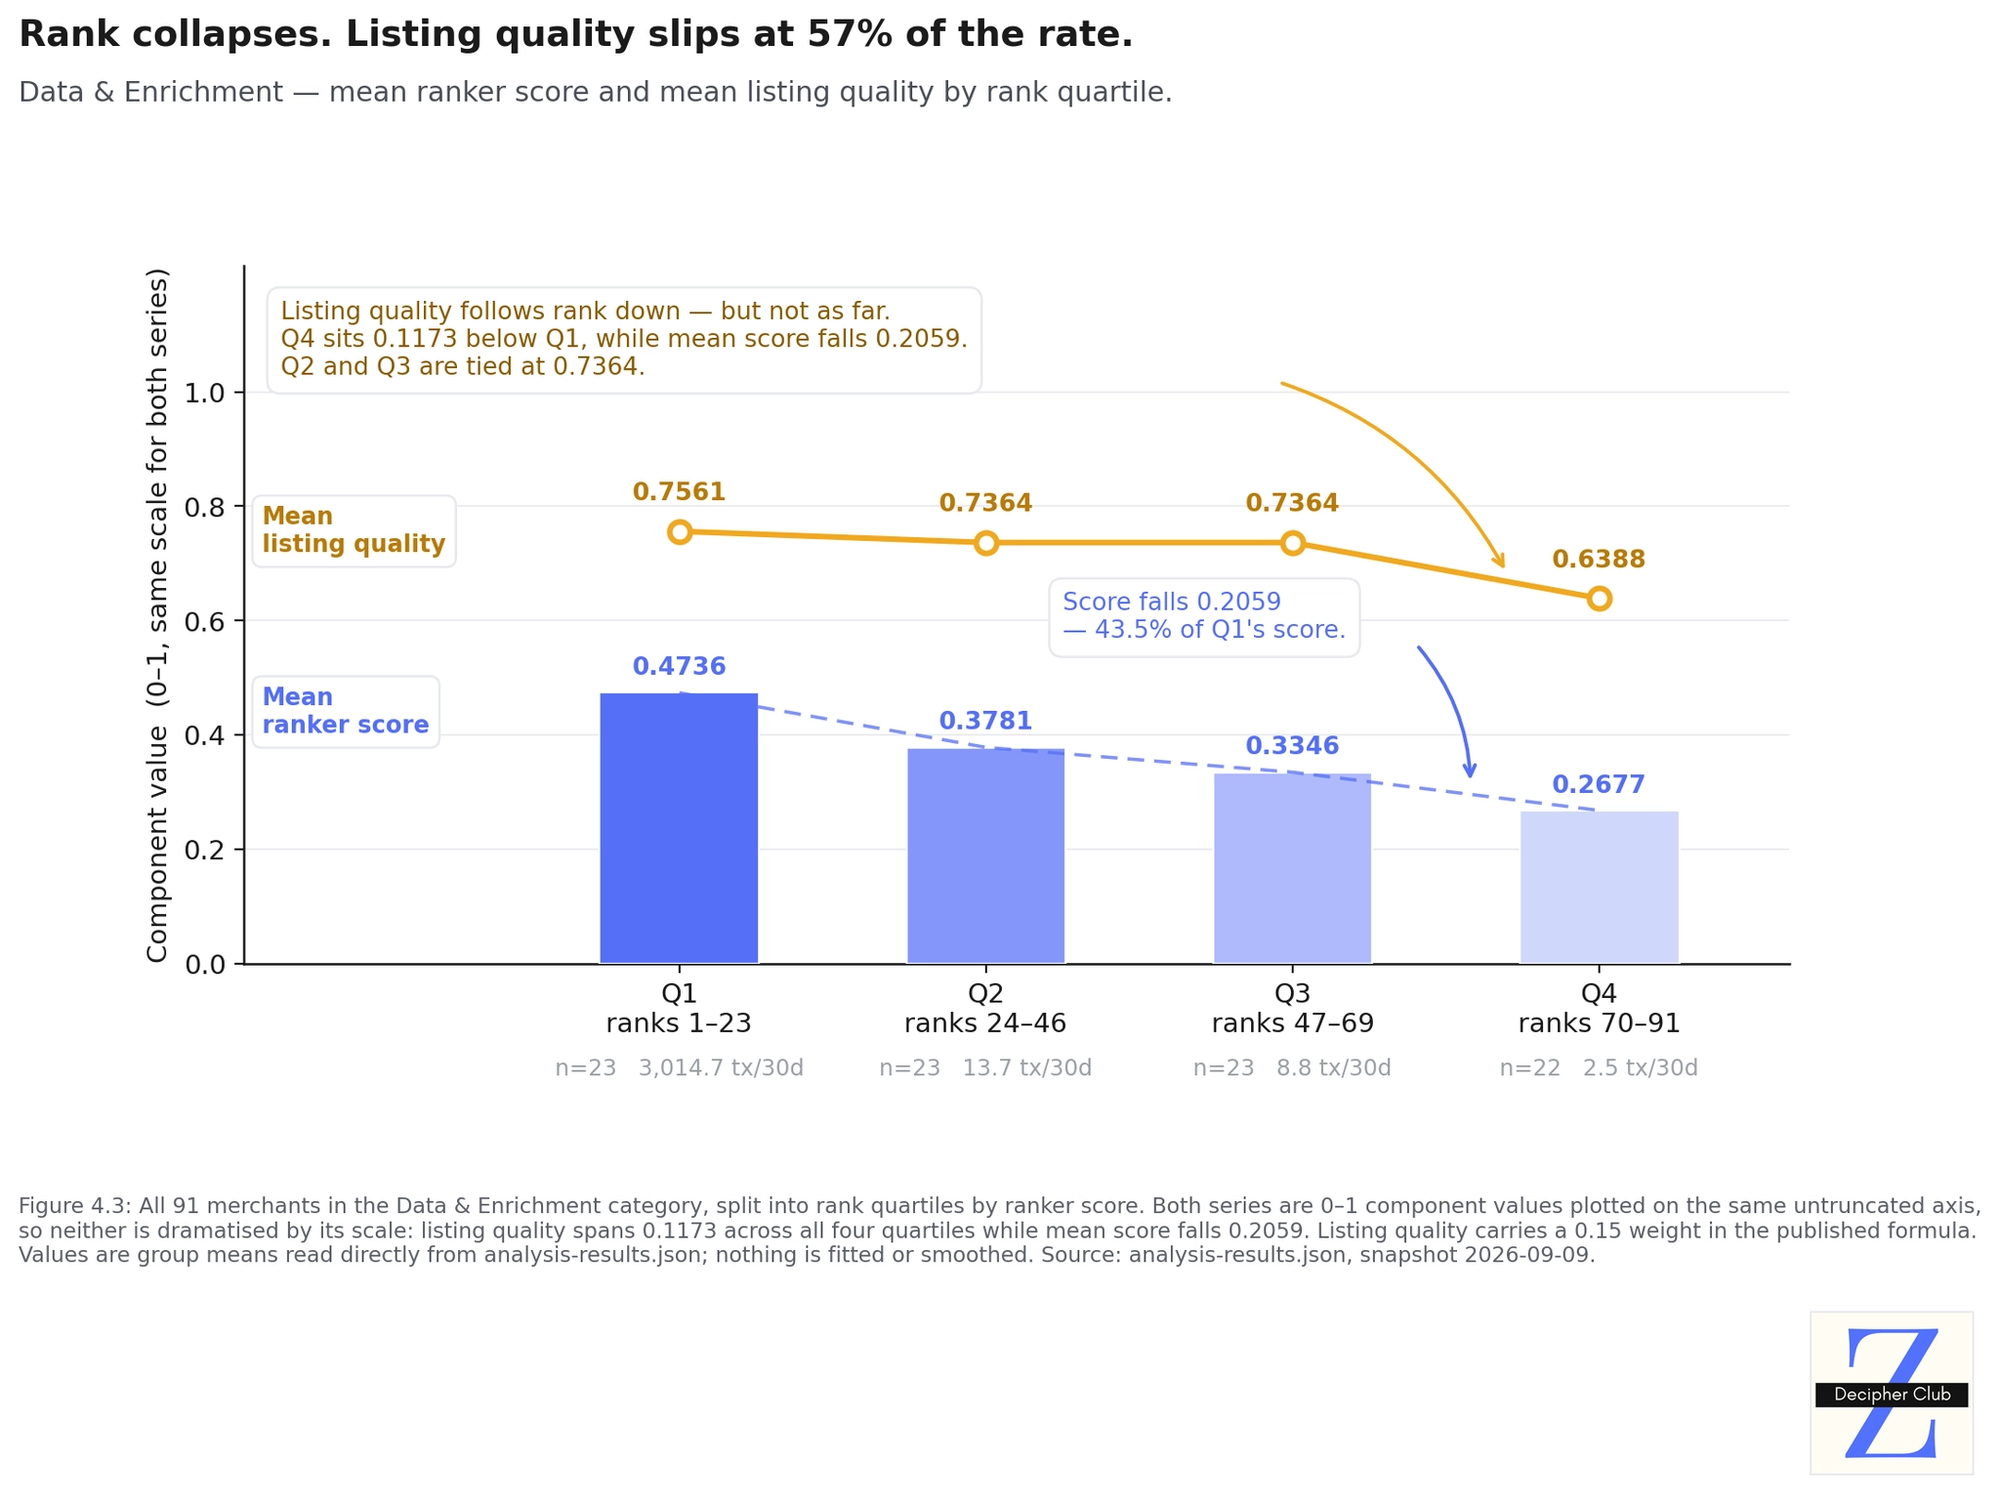
- Listing quality separates them by far less than rank does. In Data & Enrichment the top quartile scores 0.7561 against the bottom's 0.6388 — a 0.1173 spread against a 0.2059 spread in score.
- Ranker scores nonetheless differ by 0.21 to 0.30 points.
- Transaction volume and buyer diversity account for 47–74% of that gap, and above 70% in two of the four categories.
- Reliability — whether the service functions — contributes exactly 0% in every category, because no index reads it and the term is held at a constant.
A note on scope. These figures are computed against a transparent reference implementation, since the production weights are unpublished. Section 4.2 re-runs the comparison on raw catalog fields, which does not depend on any scoring formula. The full decomposition is in Section 4.2.
The consequence for Z is a closed loop. Placement requires transactions. Transactions require selection by an agent. Selection requires placement.
2.5 How this breaks x402 agentic commerce completely
The single-merchant case is a nuisance. The aggregate case is the finding.
Withdrawal is the rational response here, not the aggrieved one. A merchant that computes an expected return near zero — because placement is unreachable regardless of effort — is correct to not enter. This is not a market failure driven by discouragement. It is a stable state in which no participant has a profitable unilateral move: incumbents have no reason to defect, and newcomers have no reason to arrive.
Four consequences follow when entry stops. They are stated as mechanisms, not projections; no growth model was built for this report.
- Competitive pressure disappears without any monopolist. What disciplines an established merchant is not the rivals currently listed but the credible threat of new ones. Remove that threat and prices drift upward and feature development slows, with no coordination required among incumbents. The damage in an entry-sealed category does not come from having four merchants instead of forty.
- Quality stops being worth building. No index reads whether a general listing's service is available, fast, or correct. CDP Bazaar health-probes only its hand-curated partner tier (Section 5.2.1). Every other listing, including every new merchant, is checked only for reachability and a 402 response. Health data exists and is sold; no ranking of general listings consumes it. With no quality-of-service signal in the ordering, revenue is used as the proxy for quality. Where quality does not enter the ranking it is also unpriced, and a rational merchant does not invest in an attribute the ranking does not read.
- The degradation leaves no trace in the data. Merchants that never entered do not appear in any catalog. The market registers as healthy — listings populated, transactions settling — while the set of services that would have existed shrinks. The loss is a counterfactual, so no participant observes it, and demand does not correct.
- Agent-mediated selection removes the safety valve. Human buyers browse, follow recommendations, and occasionally select against the popular option. That noise is what lets a challenger interrupt a cascade. An agent reading a ranked list has none of it. The concentration loop therefore runs tighter here than in the human marketplaces it otherwise resembles.
Limitation. The first three mechanisms are established results in the economics of contestable markets and unobservable quality, applied here by analogy. The fourth is specific to agent-mediated selection. None is measured in this dataset.
The lock-in has no economic foundation. In conventional markets an entrenched position rests on brand loyalty, switching costs, and sunk capital. An agent has none of these. It calls a different endpoint the moment it is given a reason, and multi-homing costs a merchant nothing.
By its fundamentals this market should be highly contestable: undifferentiated services, trivial entry, frictionless switching. It is not contestable, and the reason is precise. Entry into the catalog is free. Entry into the consideration set is not.
3. Methodology, Dataset, and Provenance
Before proceeding with the core findings of my research, this section states what was measured in this research, the instruments used to measure, and on what population.
Scope of the research
- The analysis ran on a frozen snapshot of the ingested x402 catalog, collected
2026-09-09. - The snapshot holds 2,252 merchants across 13 categories.
- Findings cover four of those categories. Each sells a recognisable kind of service and has enough settled volume to measure:
- Crypto & DeFi (497 merchants),
- AI & Agents (194),
- Data & Enrichment (91), and
- Finance & Markets (57).
3.1 Metric definitions
The core analysis of this research measures how unevenly transaction volume is spread across merchants in each category. It uses two standard measures from economics. Competition regulators use the second, the HHI, to judge whether a market is dominated by a few firms.
- The Gini coefficient
- It measures inequality across a full distribution, on a scale from 0 to 1.
- It is computed over per-merchant 30-day transaction counts.
- Values above 0.70 denote extreme inequality.
- The Herfindahl-Hirschman Index (HHI)
- It is the sum of squared percentage market shares.
- It rewards single-firm dominance rather than distribution-wide spread.
- Under the 2023 DOJ and FTC Merger Guidelines, an HHI above 1,800 marks a market as highly concentrated (2023 Merger Guidelines, §2.1).
3.2 The Merchant Ranking Formulae
To compare merchants mathematically, this report derives a rank scoring formula. It gives each merchant a rank score, and that number decides the order merchants are ranked in. Every rank position and every quartile in Section 4 comes from it.
The ranking formula, however, is not assumed or randomly derived. It is inspired by the current mechanics used by the x402 marketplaces.
As of today, no discovery index publishes the score or the weights it gives a merchant. Therefore a pre-requisite to initiate the analysis was to first research what each discovery index values when it comes to ordering merchants. The 3 main discovery indices used for this research were Coinbase CDP Bazaar, x402scan and AgentCash.
Research Findings:
| Component | The live signal it stands for | Indices that use it |
|---|---|---|
| volume | 30-day transaction count and settled volume | CDP Bazaar, x402scan, AgentCash |
| buyerDiversity | 30-day distinct payers | CDP Bazaar, AgentCash |
| listingQuality | Completeness of listing metadata; generic descriptions score zero | CDP Bazaar, x402scan |
| recency | Last-called timestamp, and exclusion after 30 days of inactivity | CDP Bazaar, x402scan, AgentCash |
| reliability | Health probing of the curated tier; relay-scoped success rate | CDP Bazaar (curated tier only), x402scan (relayed calls only) |
What each term measures:
- Volume is a log-normalised blend of 30-day transaction count and settled volume.
- Buyer diversity is the log-normalised count of distinct payers.
- Listing quality is a normalised composite of schema presence, output examples, description length, service name, tag count etc.
- Recency decays to zero across 90 days.
- Reliability is held at a constant 0.5 for every merchant.
Derived Ranking Formulae
Keeping these findings in mind, the formula derived here to mirror how the real indices weight merchants today is:
```
Score = 0.40·volume + 0.25·buyerDiversity + 0.05·reliability + 0.15·listingQuality + 0.15·recency
```
Why these weights were decided:
- Volume gets 0.40, the largest share - the one signal all three major indices count, and x402scan sorts on it before anything else.
- Buyer diversity gets 0.25. Two of the three indices count distinct buyers alongside raw volume.
- Listing quality gets 0.15 as the indices use it, but as a smaller input than sales history.
- Recency gets 0.15. as recency matters; otherwise a merchant loses its position. However, it doesn’t indicate any importance in ordering of the merchant.
- Reliability gets 0.05, the smallest share. No index scores health across the whole catalog. It is kept in the formula because two indices act on health at the edges, and dropping the term would hide that.
What this formula does not cover:
Ranking of merchants happens in two steps.
- First the index decides which merchants are worth showing for a query, by matching the words in the listing against what the agent asked for.
- Then it puts those merchants in ranked order for the agents to choose from.
This formula rebuilds the second step only. The next sections of this report are primarily about the ordering, so the second step is the one that matters here.
Code and data are published at this github repository, so that any reader can change the weights and re-run the analysis.
4. Empirical Findings
This section is the core of the report and it runs three tests in sequence:
- Section 4.1: Volume Concentration measures how transaction volume distributes across the merchants in a category.
- Section 4.2: Quality-Rank Disconnect measures whether the merchants that rank have consistent and adequate listings, a.k.a, full input schemas, worked output examples, detailed descriptions and tags.
- Section 4.3: The Cold-Start Ceiling computes the highest score that a merchant with no trading history can reach, and sets it against what incumbents hold.
By the end of this section, I aim to establish through my research how:
- the current x402 markets are not well-suited for merchants to grow or new merchants to join,
- eventually leading to a market that becomes extremely monopolistic and quietly stops renewing itself - hence dies.
4.1 Volume Concentration
Volume here means settled transaction count — the number of x402 payments a merchant completed in the 30-day window ending at the snapshot.
Note: Volume should not be confused with revenue. A merchant selling ten thousand calls at $0.001 has high volume and low revenue, and the ranking reads the former.
The analysis performed in this research:
- Every merchant in the four analyzed categories, together with the number of x402 payments it settled in the 30-day window ending at the snapshot.
- The merchants in each category were lined up in order of transaction count, from the largest seller down to the smallest.
- 3 standard measures were run across that line-up:
- how evenly payments are shared,
- how far the largest sellers dominate,
- and how much the top three take between them.
Output of the Analysis
| Category | Merchants | 30d Volume | 30d Txs | Gini | HHI | Top-3 Share |
|---|---|---|---|---|---|---|
| Crypto & DeFi | 497 | $34,673.65 | 62,863 | 0.8975 | 400 | 28.1% |
| AI & Agents | 194 | $1,014.46 | 18,766 | 0.9630 | 2,440 | 77.2% |
| Data & Enrichment | 91 | $2,166.29 | 69,911 | 0.9766 | 8,310 | 95.4% |
| Finance & Markets | 57 | $880.70 | 2,175 | 0.7371 | 783 | 37.4% |
Understanding the parameters
- Gini — how evenly payments are shared across a category: It runs on a scale from 0 to 1.
- 0 would mean every merchant in the category made the same number of sales.
- 1 would mean one merchant made all of them and everyone else made none.
- Every category here falls between 0.74 and 0.98, which sits far closer to the second case than the first.
- HHI - It squares each merchant's share of payments before adding them together, so one large seller counts for far more than several small ones.
- Ten equally-sized merchants would score 1,000.
- For example: Data & Enrichment scores 8,310, which is the signature of a single merchant holding most of a market.
- Note: US competition regulators treat any market scoring above 2,500 as highly concentrated.
- Top-3 share — what the three biggest merchants take between them. It is simply their combined share of everything sold.
- In Data & Enrichment the top three merchants collect 95.4% of every payment made in the category.
- The remaining eighty-eight merchants divide what is left, which is under five per cent.
Core takeaways
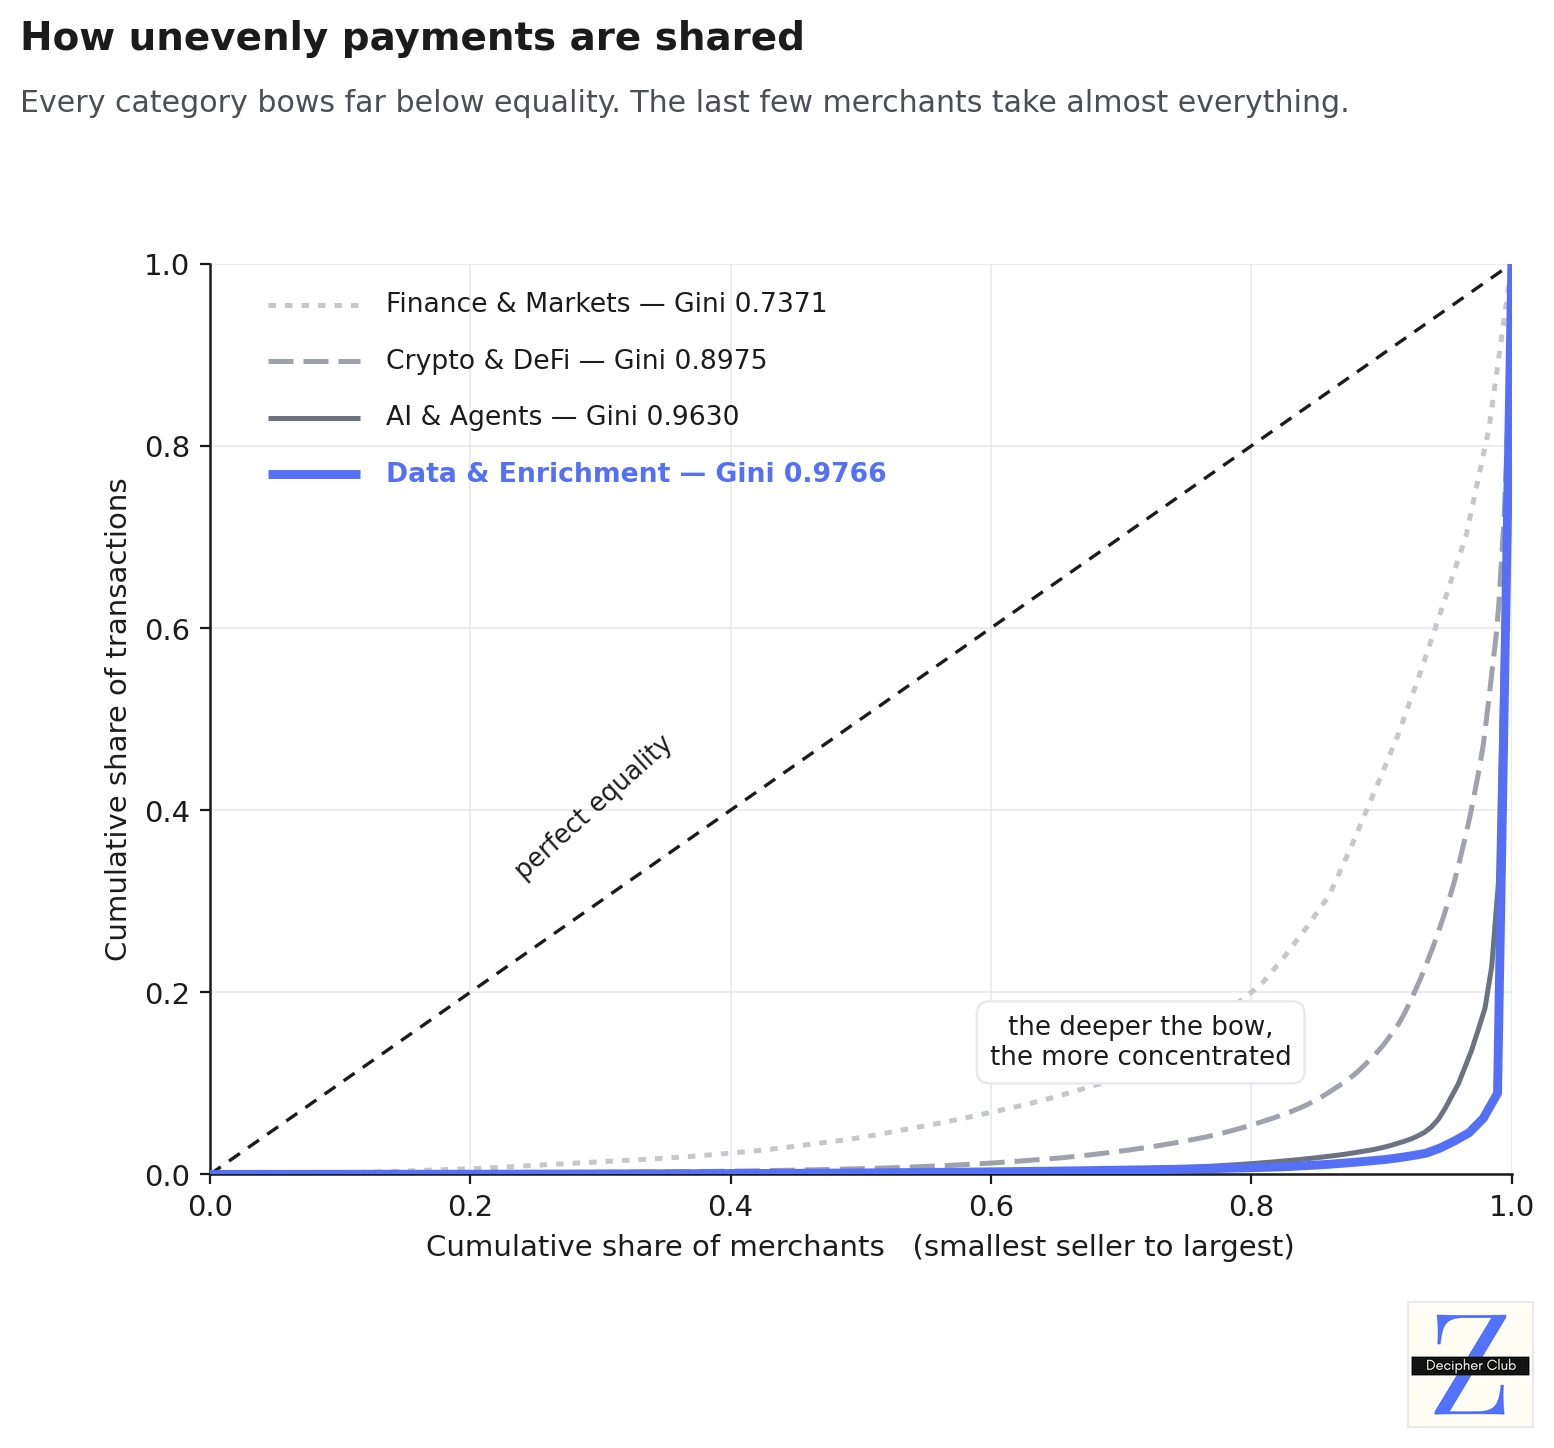
- Payment volume in x402 is concentrated to an extreme degree. Not merely uneven — extreme by the thresholds used to regulate conventional markets.
- This holds in every category measured. All four categories exceed Gini 0.73, despite differing in size by nearly an order of magnitude.
- One category, Data & Enrichment, is effectively a monopoly. 3 merchants out of 91 take more than nine of every ten payments in this category.
- 2 of the 4 categories sit at the level of national wealth inequality. Ginis above 0.96 are the range recorded for wealth distribution in the most unequal economies on earth.
- Data & Enrichment has the worst spread of the four (Gini 0.9766) and by far the heaviest single-firm dominance (HHI 8,310). Crypto & DeFi, the largest category, is the least dominated (HHI 400).
Real-World Merchant Example
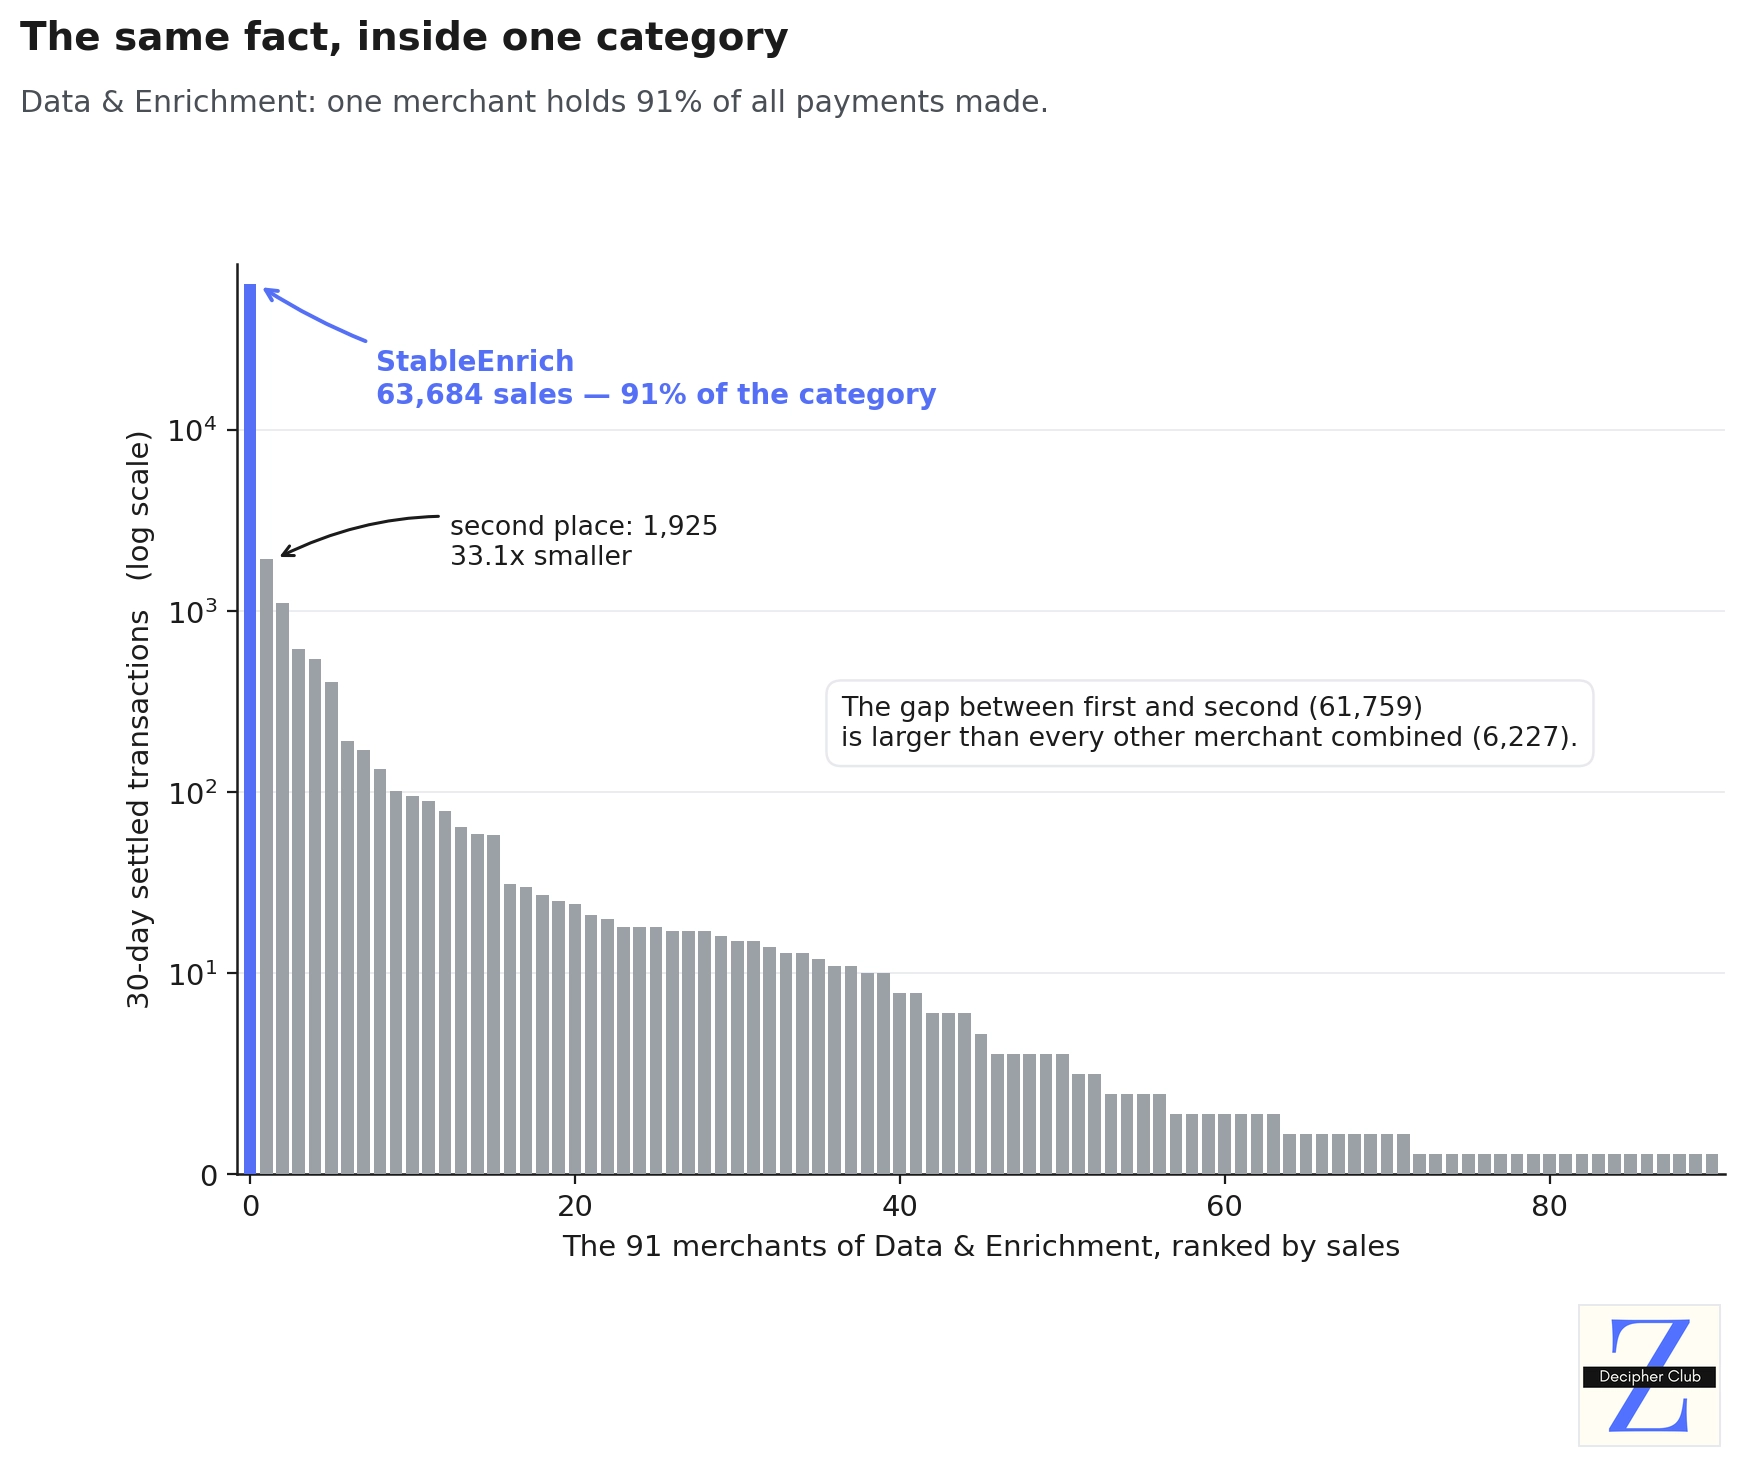
- StableEnrich holds rank #1 in Data & Enrichment:
- with 63,684 settled transactions from 695 distinct buyers in the window — 91.1% of the category's entire transaction count, held by a single merchant.
- Google Trends SEO Keyword Data is the second-largest seller in that same category:
- with 1,925 settled transactions from 22 distinct buyers — 2.8% of the category.
- Note: StableEnrich sells 33.1 times more than the merchant directly behind it. The gap between first and second place (61,759 transactions) is larger than the combined sales of all ninety other merchants in the category (6,227).
- Otto AI shows the same pattern in the largest and least concentrated category:
- it is the biggest seller in Crypto & DeFi by transaction count, with 7,764 settled payments from 776 buyers — 12.4% of a category containing 497 merchants.
4.2 The Listing-Quality & Ranking-Order Disconnect
Now, let’s go back to the example of merchant Z, trying to compete with established merchants A, B, C, etc.
When merchant Z observes no orders from agents, the next logical move is to fix the problem with the tools it has. In other words, the listing is the only surface it controls. Therefore, the rational response is to improve the quality of its service listing, such as improving its description, adding tags, and publishing input schemas and worked output examples. For instance, CDP's own published guidance for sellers instructs exactly this: provide realistic output examples, document inputs with schemas and descriptions, and write natural-language descriptions which, it states, "rank higher in semantic search than bare endpoint names" (CDP Bazaar documentation, Best practices for sellers).
Note: listing quality measures documentation, not whether the service actually works. No index reads service health across its whole catalog, which is why reliability is held at a constant.
However, does this actually work for merchant Z in a reliable way?
The analysis performed in this research:
- Every merchant in the four analysed categories, with its listing-quality score and its rank position
- Each category's merchants were sorted by rank, then cut into four equal groups. Q1 is the top quarter, Q4 the bottom quarter. — aka the Quartile and Rank range columns.
- A comparison was performed of the average listing quality of the top group against the bottom group. If documentation drove rank, the documentation difference between Q1 and Q4 should account for most of the score difference between them — aka the Listing quality column, read against the Mean score column.
- The score gap between Q1 and Q4 was split across the five scoring components, to identify which ones actually produce it — aka the Mean score column, split across the Volume, Buyer div., Reliability, Listing quality and Recency columns.
- The same quartiles were re-measured on raw catalog fields with no scoring applied, as a check that the decomposition is not an artefact of the formula — no column in the table below; this control is reported separately, after the decomposition.
Output of the Analysis
| Quartile | Rank range | Mean score | Volume | Buyer div. | Reliability | Listing quality | Recency |
|---|---|---|---|---|---|---|---|
| Q1 | 1–23 | 0.4736 | 0.2409 | 0.3606 | 0.5000 | 0.7561 | 0.9913 |
| Q2 | 24–46 | 0.3781 | 0.1049 | 0.2027 | 0.5000 | 0.7364 | 1.0000 |
| Q3 | 47–69 | 0.3346 | 0.0662 | 0.1351 | 0.5000 | 0.7364 | 0.9261 |
| Q4 | 70–91 | 0.2677 | 0.0413 | 0.0934 | 0.5000 | 0.6388 | 0.7136 |
The gap-decomposition table. The same decomposition runs in all four categories.
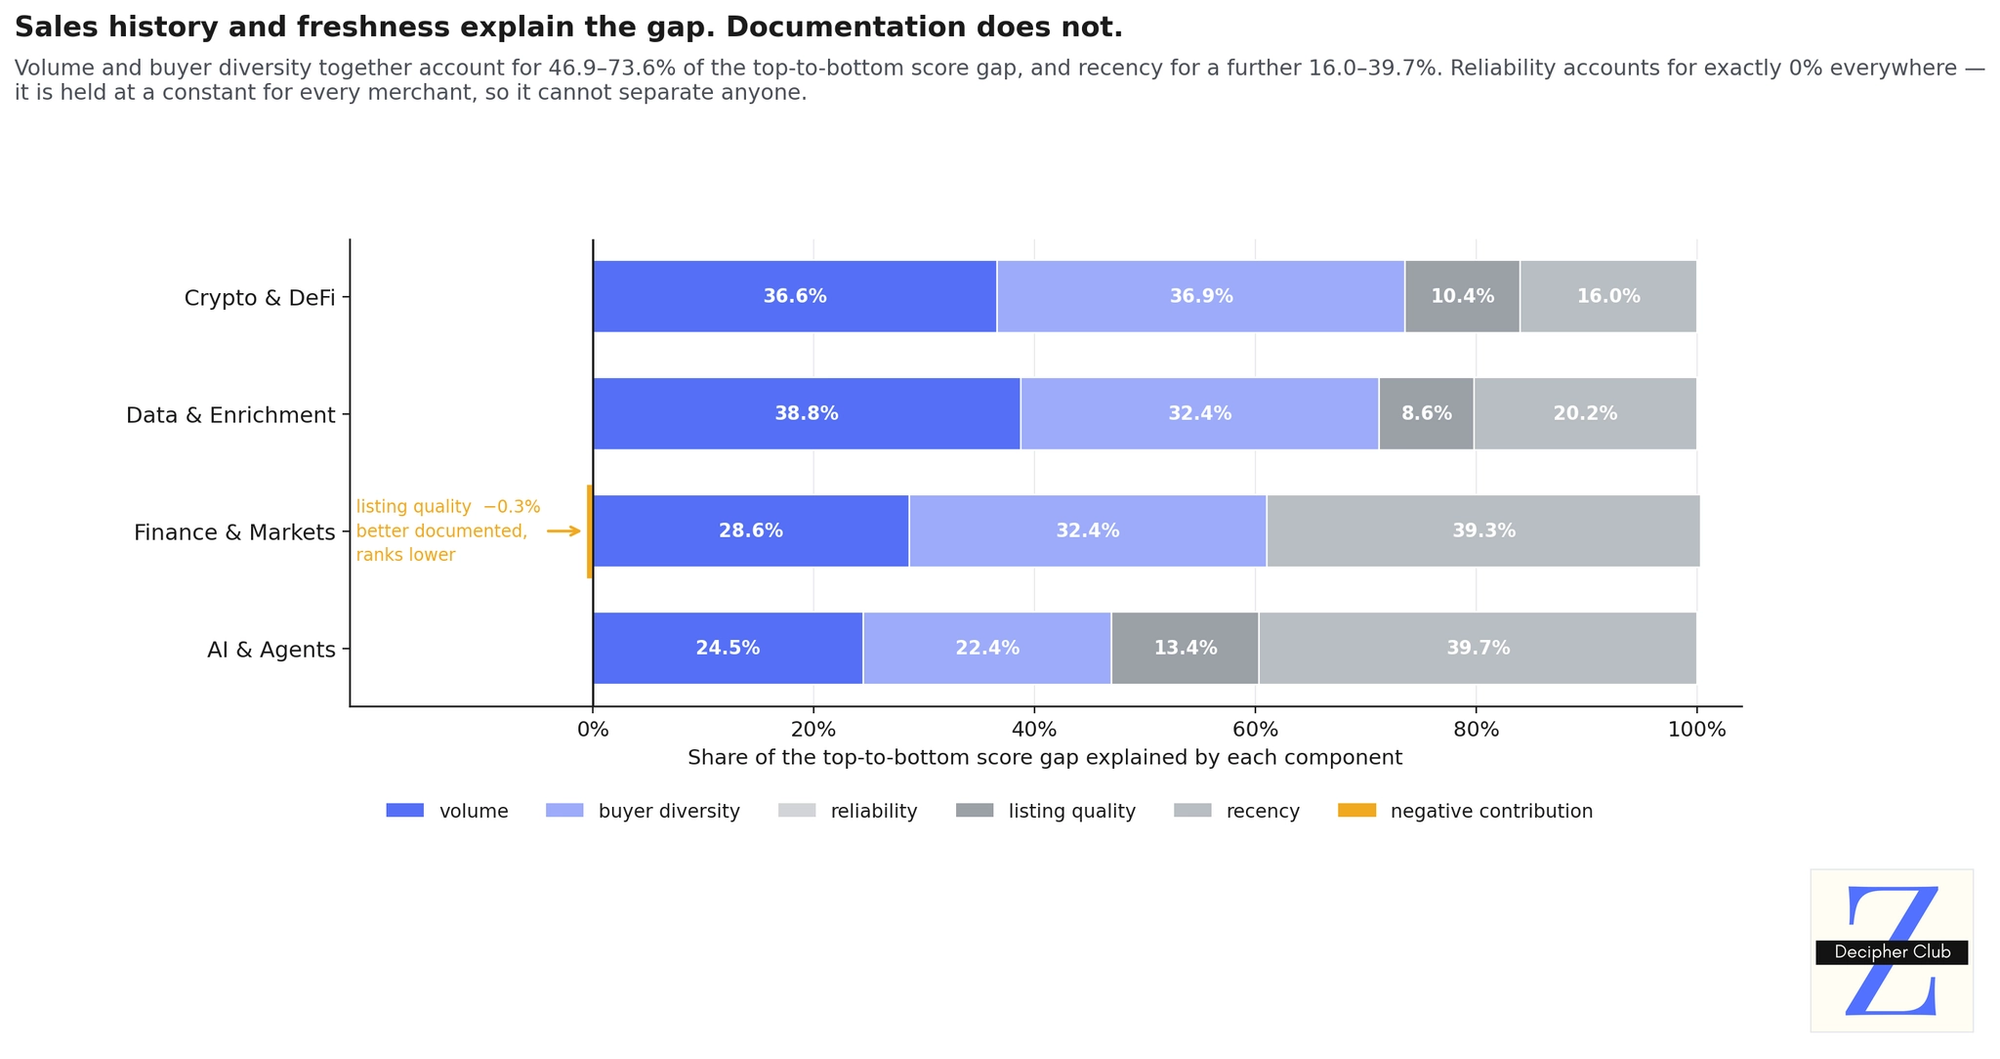
The Q1–Q4 score gap splits into the contribution of each component:
| Category | Volume | Buyer diversity | Reliability | Listing quality | Recency |
|---|---|---|---|---|---|
| Crypto & DeFi | 36.6% | 36.9% | 0% | 10.4% | 16.0% |
| AI & Agents | 24.5% | 22.4% | 0% | 13.4% | 39.7% |
| Data & Enrichment | 38.8% | 32.4% | 0% | 8.6% | 20.2% |
| Finance & Markets | 28.7% | 32.4% | 0% | −0.3% | 39.3% |
Category figures are rounded independently, so displayed columns may not sum exactly to stated totals.
Breakdown of numbers
- Quartile and Rank range — how the merchants were grouped: each category's ranked list was cut into four equal parts.
- Q1 holds the highest-ranked quarter, Q4 the lowest.
- In Data & Enrichment that is ranks 1–23, 24–46, 47–69 and 70–91.
- Mean score — the average overall score in each group: this is the number that sets rank order.
- It falls from 0.4736 in Q1 to 0.2677 in Q4, a drop of 0.2059, or 43.5%.
- In a 91-merchant category that is the difference between page-one placement and never being rendered to a buying agent.
- Listing quality — the documentation column, and the one to watch: this is the part of the score a merchant fully controls.
- Q1 scores 0.7561. Q4 scores 0.6388. The top group is better documented, by 0.1173 on a 0–1 scale.
- The score spread between the same two groups is 0.2059. Documentation moves with rank, but at 57% of its rate.
- The same comparison holds in two other categories. Crypto & DeFi's top quartile leads its bottom quartile by 0.1582 on listing quality, and AI & Agents' by 0.2655. Finance & Markets runs the other way: its bottom quartile leads by 0.0045.
- Q2 and Q3 are tied at 0.7364, despite twenty-three rank places between them.
- Volume and Buyer diversity — the two history columns: these count settled transactions and distinct payers.
- Both collapse from top to bottom: volume 0.2409 → 0.0413, buyer diversity 0.3606 → 0.0934.
- They fall faster than any other column. Volume drops 83% from Q1 to Q4 and buyer diversity 74%, against 16% for listing quality and 28% for recency.
- Reliability — the constant column: it reads 0.5000 in every quartile of every category.
- A term identical for everyone cannot explain a difference between anyone.
- Note: the zero is an unread signal, not a measured tie.
- The gap-decomposition percentages — which columns actually produce the gap: each figure is that component's share of the Q1–Q4 difference.
- Volume and buyer diversity together account for 47–74% of it: 73.6%, 46.9%, 71.2% and 61.1% across the four categories, with AI & Agents the sole case below half.
- Listing quality accounts for at most 13.4% anywhere, and −0.3% in Finance & Markets.
- Note: a negative share means the component runs against rank — better-documented merchants sit lower.
Core takeaway
- The core finding of this analysis is that Listing quality is not what sets a merchant's position in the x402 catalog. Sales history is.
- The merit hypothesis fails on magnitude. Top-quartile merchants are better documented than bottom-quartile ones in three of the four categories, by 0.12 to 0.27 on a 0–1 scale. That difference accounts for 8.6% to 13.4% of the score gap between them. Sales history and freshness account for the rest.
- The pattern is not confined to one category. Listing quality accounts for at most 13.4% of the top-to-bottom gap anywhere in the dataset, and runs negative in Finance & Markets.
- The raw catalog fields agree. With no score applied, Data & Enrichment's top quartile publishes more output examples than its bottom quartile, while the bottom quartile carries longer descriptions and more tags. Documentation differs between the groups in both directions. It is not what separates their scores.
- Documentation is an admission signal, not the ordering signal. It determines whether a merchant enters the catalog — CDP scores a generic description at zero. Once a merchant is admitted, documentation moves its position only at the margin. Documentation gets a merchant listed; it does not get a merchant discovered.
Real-World Merchant Example
- Honeyguide Verified Router carries the best listing in its category and cannot be found:
- listing quality 0.9077 — the highest of any merchant in Crypto & DeFi.
- It ranks #250 of 497, on three settled transactions in thirty days.
- Penny API is better documented than the average of its category's entire top quartile:
- listing quality 0.8536, sitting in Q4 of Data & Enrichment at rank #85 of 91.
- It out-documents the Q1 average of 0.7561 and ranks below every merchant in that quartile.
- Pre-Trade Intelligence Hub shows the same pattern in a third category:
- listing quality 0.8416 in Finance & Markets, at rank #55 of 57.
- Three settled transactions from a single buyer. A near-complete listing in the smallest category examined still leaves a merchant at the floor.
All three did what the platform guidance asks. None is discoverable.
4.3 The Cold-Start Ceiling
Every merchant begins with no sales history.
In other words, the merchant is listed in the catalog, but with nothing yet recorded in the two specific criteria that the ranking weighs most heavily:
- how many payments it has settled ( volume ) and,
- how many separate buyers it has served ( buyer diversity )
Those two things make up 65% of a merchant's score. And neither can be filled in by effort, because both are counts of sales that have already happened.
Now, the cold-start ceiling can be defined as the highest score a merchant in that position can reach. This is not what an average new merchant scores but the best any of them could possibly score, having filled in every field perfectly and left nothing undone.
Note: this ceiling is computed from the published weights. It is not a score observed in the data. Whether any real merchant actually reaches it is a separate question, and the analysis below answers that one too.
What this analysis tries to achieve?
The ceiling on its own means nothing. It only matters when set against what the merchants already at the top of a category hold.
So the question this analysis section answers is narrow: is a perfect newcomer's best possible score enough to compete with the merchants already ranked above it?
- If it is, then Sections 4.1 and 4.2 describe a young market rather than a closed one, and a good service would climb given time,
- If it is not, then no amount of time or effort changes the outcome — and the concentration measured in 4.1 is permanent by construction.
In most markets a new business solves this by simply operating. It makes a few sales, those sales make it easier to find, and it grows from there.
That does not work here, and the reason is circular.
In x402 markets as of today:
- 2 components — settled transactions and distinct buyers — make up 65% of the score.
- And both stay at zero until an agent actually buys from the merchant.
- However, an agent only finds the merchant if it already ranks well, and it cannot rank well while those two components are zero.
The analysis performed in this research:
- The five scoring components and their fixed weights were taken from the formula in Section 3.2 — the Component and Weight columns.
- For each component, the best value a merchant with no trading history could possibly achieve was worked out. Volume and buyer diversity are zero by definition, since both count settled payments — the Day-one maximum column.
- Each maximum was multiplied by its weight to give what that component adds to the total score — the Contribution column, which sums to the ceiling.
- The resulting ceiling was then set against the mean score of each category's three highest-selling incumbents, to measure the distance a newcomer must cover — the Top-3 mean and Gap columns in the second table.
- Finally, every zero-transaction merchant in the dataset was checked against the computed ceiling, to test whether the arithmetic holds in practice.
The arithmetic below puts a number on that. It shows the best a merchant with no sales history can score, component by component:
| Component | Weight | Day-one maximum | Contribution |
|---|---|---|---|
| Volume | 0.40 | 0.0000 — no transactions | 0.0000 |
| Buyer diversity | 0.25 | 0.0000 — no buyers | 0.0000 |
| Reliability | 0.05 | 0.5000 — the constant | 0.0250 |
| Listing quality | 0.15 | 1.0000 — perfect metadata | 0.1500 |
| Recency | 0.15 | 1.0000 — fresh listing | 0.1500 |
| Total | 1.00 | 0.3250 |
The ceiling is 0.3250. The floors it must reach are the mean scores of each category's three highest-selling incumbents:
| Category | Day-one ceiling | Top-3 mean | Gap |
|---|---|---|---|
| Crypto & DeFi | 0.3250 | 0.6504 | 0.3254 |
| Data & Enrichment | 0.3250 | 0.5951 | 0.2701 |
| AI & Agents | 0.3250 | 0.5489 | 0.2239 |
| Finance & Markets | 0.3250 | 0.5366 | 0.2116 |
Breakdown of numbers
- Component and Weight — what the score is made of: the five inputs and how much each one counts.
- Volume (0.40) and buyer diversity (0.25) together are 65% of the score.
- Listing quality (0.15) and recency (0.15) are 30%.
- Reliability (0.05) is the remaining 5%.
- Day-one maximum — the best a new merchant could possibly score on each: this is where the constraint bites.
- Volume and buyer diversity read 0.0000. Both count settled payments, and a merchant with no sales has none, however good the service is.
- Listing quality and recency can both reach 1.0000 on day one.
- Reliability reads 0.5000, the constant every merchant receives.
- Contribution — what each component actually adds: the maximum multiplied by the weight.
- The two largest components contribute nothing at all.
- Everything a new merchant can earn totals 0.3250: metadata 0.150, freshness 0.150, and the reliability constant 0.025.
- Note: freshness decays to zero over 90 days on its own, whether or not the merchant improves anything.
- Top-3 mean — the incumbent floor a newcomer must reach: the average score of each category's three highest-selling merchants — the three that settled the most transactions in the window.
- It ranges from 0.5366 in Finance & Markets to 0.6504 in Crypto & DeFi.
- Gap — the distance between the two: what a perfect newcomer still lacks after doing everything right.
- The smallest gap anywhere is 0.2116, in Finance & Markets.
- Perfect documentation is worth 0.150 in total, so even the easiest category demands more than documentation can supply.
- Note: the most commonly proposed fix — populating the reliability slot with a real uptime signal — adds at most 0.025, because the constant already grants 0.025 of the 0.05 weight. No gap in the table is within reach of it.
Core takeaway
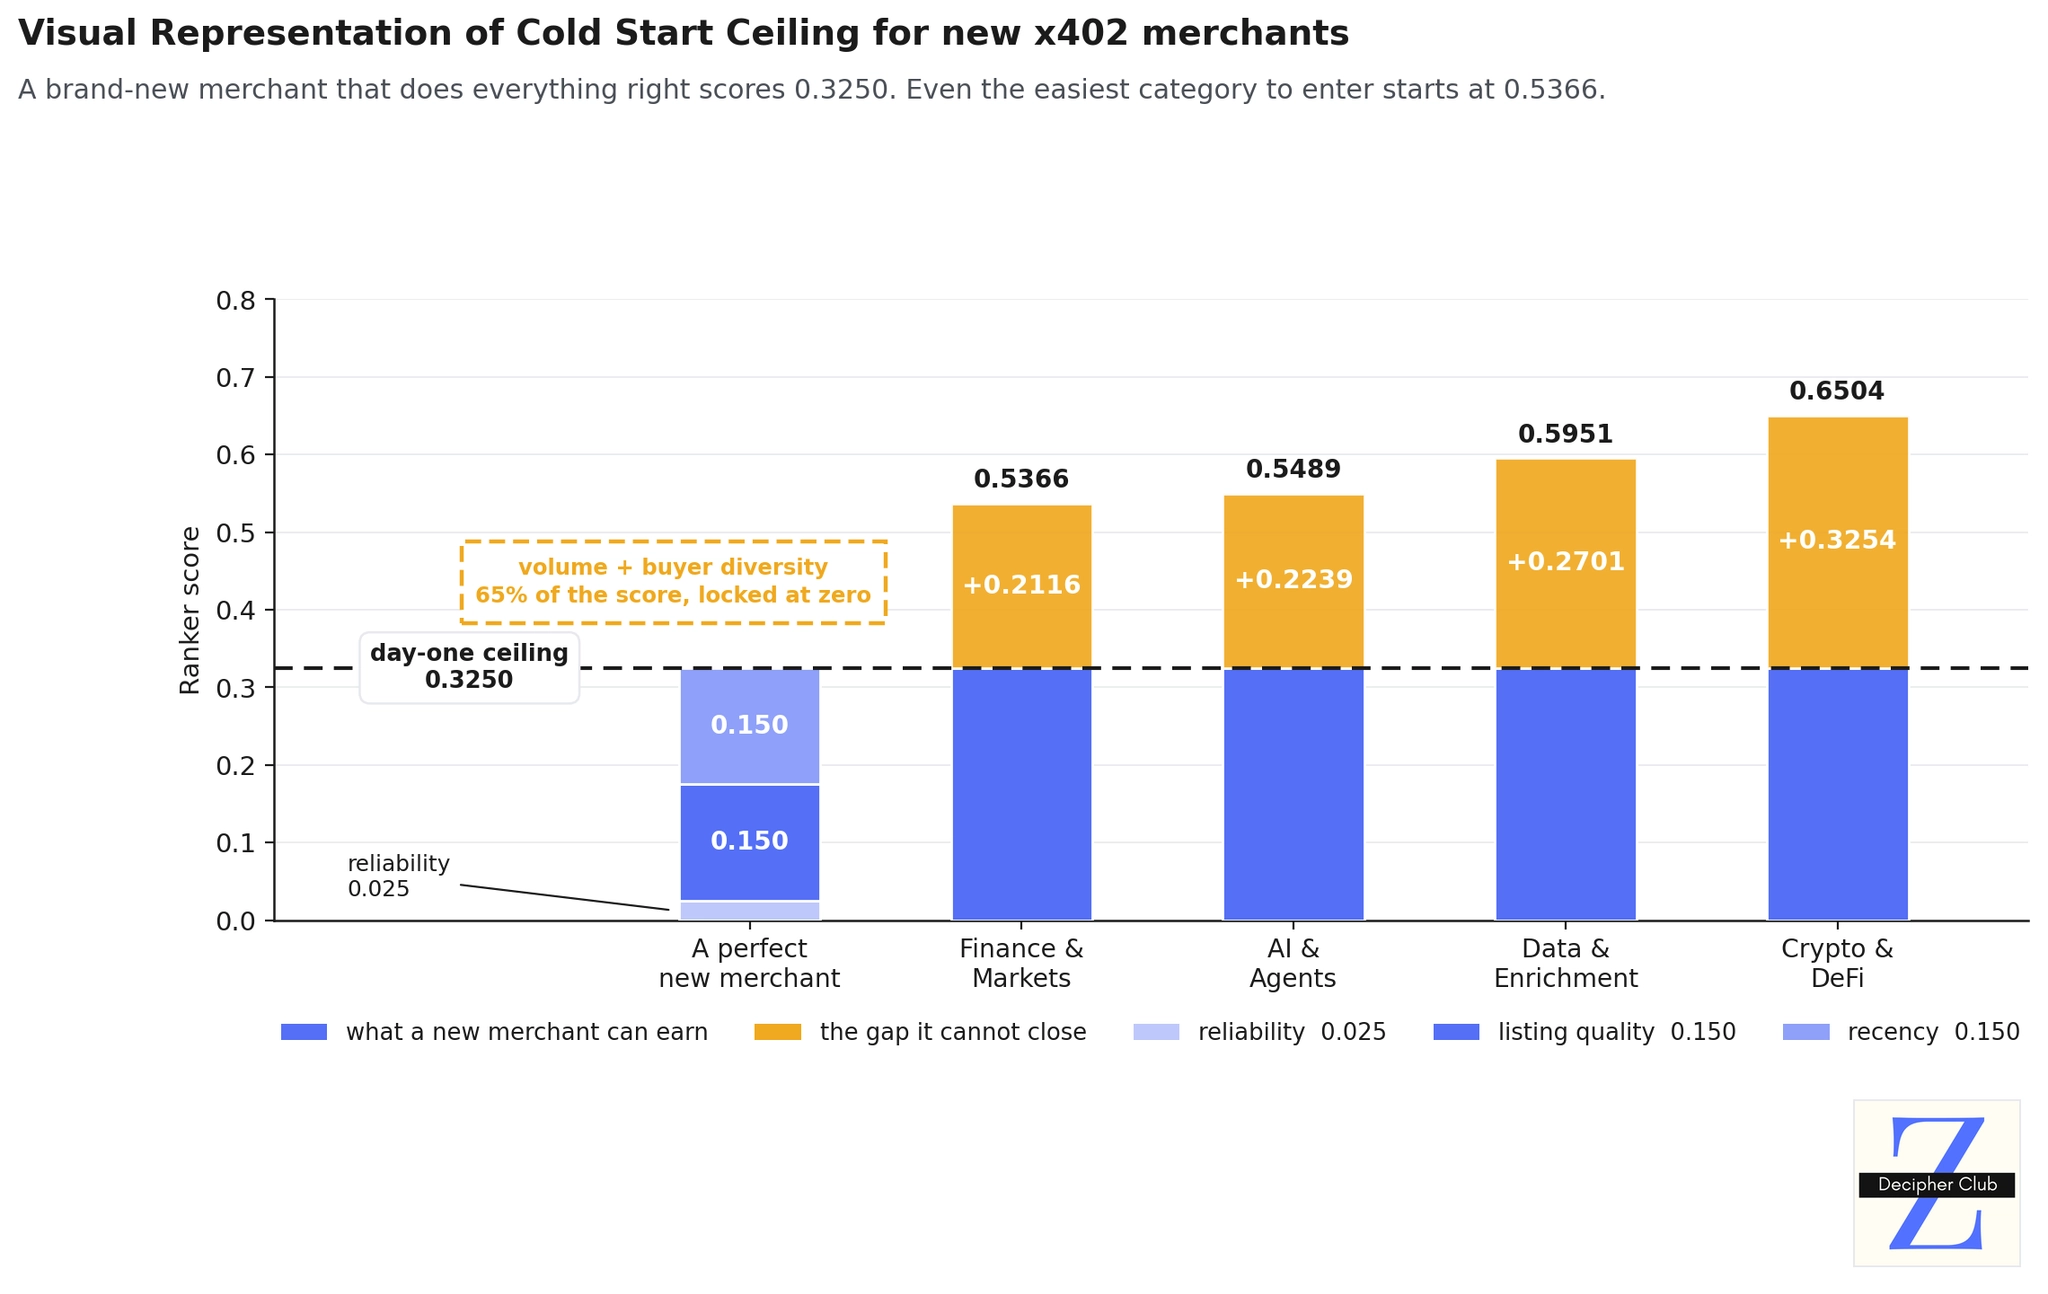
- Waiting does not close the gap. This is not a slow start that time fixes. The shortfall is a fixed gap in the arithmetic, and it is wider than everything a new merchant is able to earn.
- 65% of the score is unreachable on day one. Volume and buyer diversity both count settled payments, so a merchant with no history scores zero on both regardless of how good its service is.
- The arithmetic holds in the live data. Of the 79 zero-transaction merchants across the four categories, not one scores above 0.3250. Seventy-two were registered in one batch by a single operator and left idle, so the independent test is the remaining seven. The highest observed is 0.2965, which is below the ceiling rather than on it — no merchant has filled every controllable field at once. The bound holds in the live data, and nothing reaches it.
- The gap is self-perpetuating, and the loop is short.Closing it requires volume > Volume requires being selected by an agent > Being selected requires rank > Rank requires volume.
Real-World Merchant Example
- Suede Agent Studio is the closest any merchant comes to the ceiling:
- listing quality 0.8099, recency 1.0000, zero transactions and zero buyers, in Crypto & DeFi.
- It scores 0.2965 against a ceiling of 0.3250. It has done nearly everything a merchant can do and still sits below the arithmetic maximum.
- It ranks #312 of 497. Three hundred and eleven merchants sit above it, and no action available to it closes that distance.
- Open Source Filings is the same case at the floor of another category:
- a SEC-filings API covering 13F holdings, insider transactions and EDGAR financials, with listing quality 0.8096 and zero settled transactions.
- It scores 0.2964 and sits at rank #47 of 57 in Finance & Markets.
- Arkham x402 shows what it is measured against, in that same category:
- rank #1 of 57, with 393 settled transactions from 54 buyers, scoring 0.5810.
- Note: its listing quality is 0.7651 — lower than Open Source Filings' 0.8096. The best-ranked merchant in the category is less completely documented than the merchant sitting forty-six places below it. What separates them is 393 transactions.
Through our analysis, we have clearly confirmed 3 imperative findings in x402 markets today:
- Volume is concentrated.
- The ranking order does not track listing quality.
- And the resulting gap between new merchants and existing players cannot be closed by any meaningful action by a new merchant.
Section 5 of this report explores possibilities and potential fixes for these bugs in the x402 markets.
5. Solving the Discovery Layer for agentic markets
Discovery in agentic markets is the new bottleneck.
Currently, discovery in open agentic commerce ranks merchants on settled volume, so demand concentrates on whoever arrived first and a new merchant has no reachable way in.
This section proposes potential solutions to this problem. They fall into three groups:
- Fair first chance (5.1) — how a merchant with no sales history gets shown to an agent at all.
- Outcome-based discovery (5.2) — how the result of each purchase flows back into which merchants the next agent finds.
- Capability-first ranking (5.3) — what a ranking can read before a merchant has any sales.
Constraints every proposal must survive
Every proposed solution must satisfy the following constraints, based on my research so far. The potential fixes are proposed with these constraints in mind to eliminate inadequate solutions.
| # | Constraint | Source |
|---|---|---|
| C1 | No ordering on settled volume. Any volume term reproduces the 4.3 ceiling at any weight. | §4.3 |
| C2 | No reliance on buyer-agent cooperation. Agents select from the top of one ranked response. A surface agents must opt into is a surface that is never read. | §2.1 |
| C3 | No scoring of free text. LLM agents are reliably steered by adversarially written descriptions (MPMA, AAAI 2026). A quality signal must be verified behaviour, not persuasive prose. | External |
| C4 | No unconditional subsidy. A payee address costs nothing, so an unconditional boost is an invitation to mint listings. | §2.2 |
| C5 | Self-termination. A permanent newcomer benefit is a second ranking with a different bias. | Design |
5.1 Fair First Chance: Getting a New Merchant Seen
The solutions in this group serve one purpose. They give small, struggling or brand-new merchants a way to be shown to agents before they have a sales record.
There are three potential mechanisms:
- Reserved slots (5.1.1) set aside a few places in every response for new merchants.
- An exposure-based head start (5.1.2) gives new merchants a boost that ends after they have been shown enough times.
- Treating missing history as uncertainty (5.1.3) changes how the ranking scores any merchant it knows little about.
5.1.1 Reserved Slots & Staking Mechanism
When an agent scouts for a specific service today, the discovery response is one ranked list, ordered on settled volume (aka record-based data). In simpler words, the merchants with the most sales and buyers appear first for the buyer agent. An agent reads the top 2-3 listed merchants, selects one, and stops. A merchant with no sales never appears high enough to be read, so it never earns the sales that would raise it.
Proposed Solution:
The proposed solution comes in two parts, used together:
- Reserved Slot Mechanism, and
- Staking Mechanism
Reserved Slot Mechanism
Reserve a fixed, small share of every discovery response for merchants below a settlement threshold, and publish that threshold.
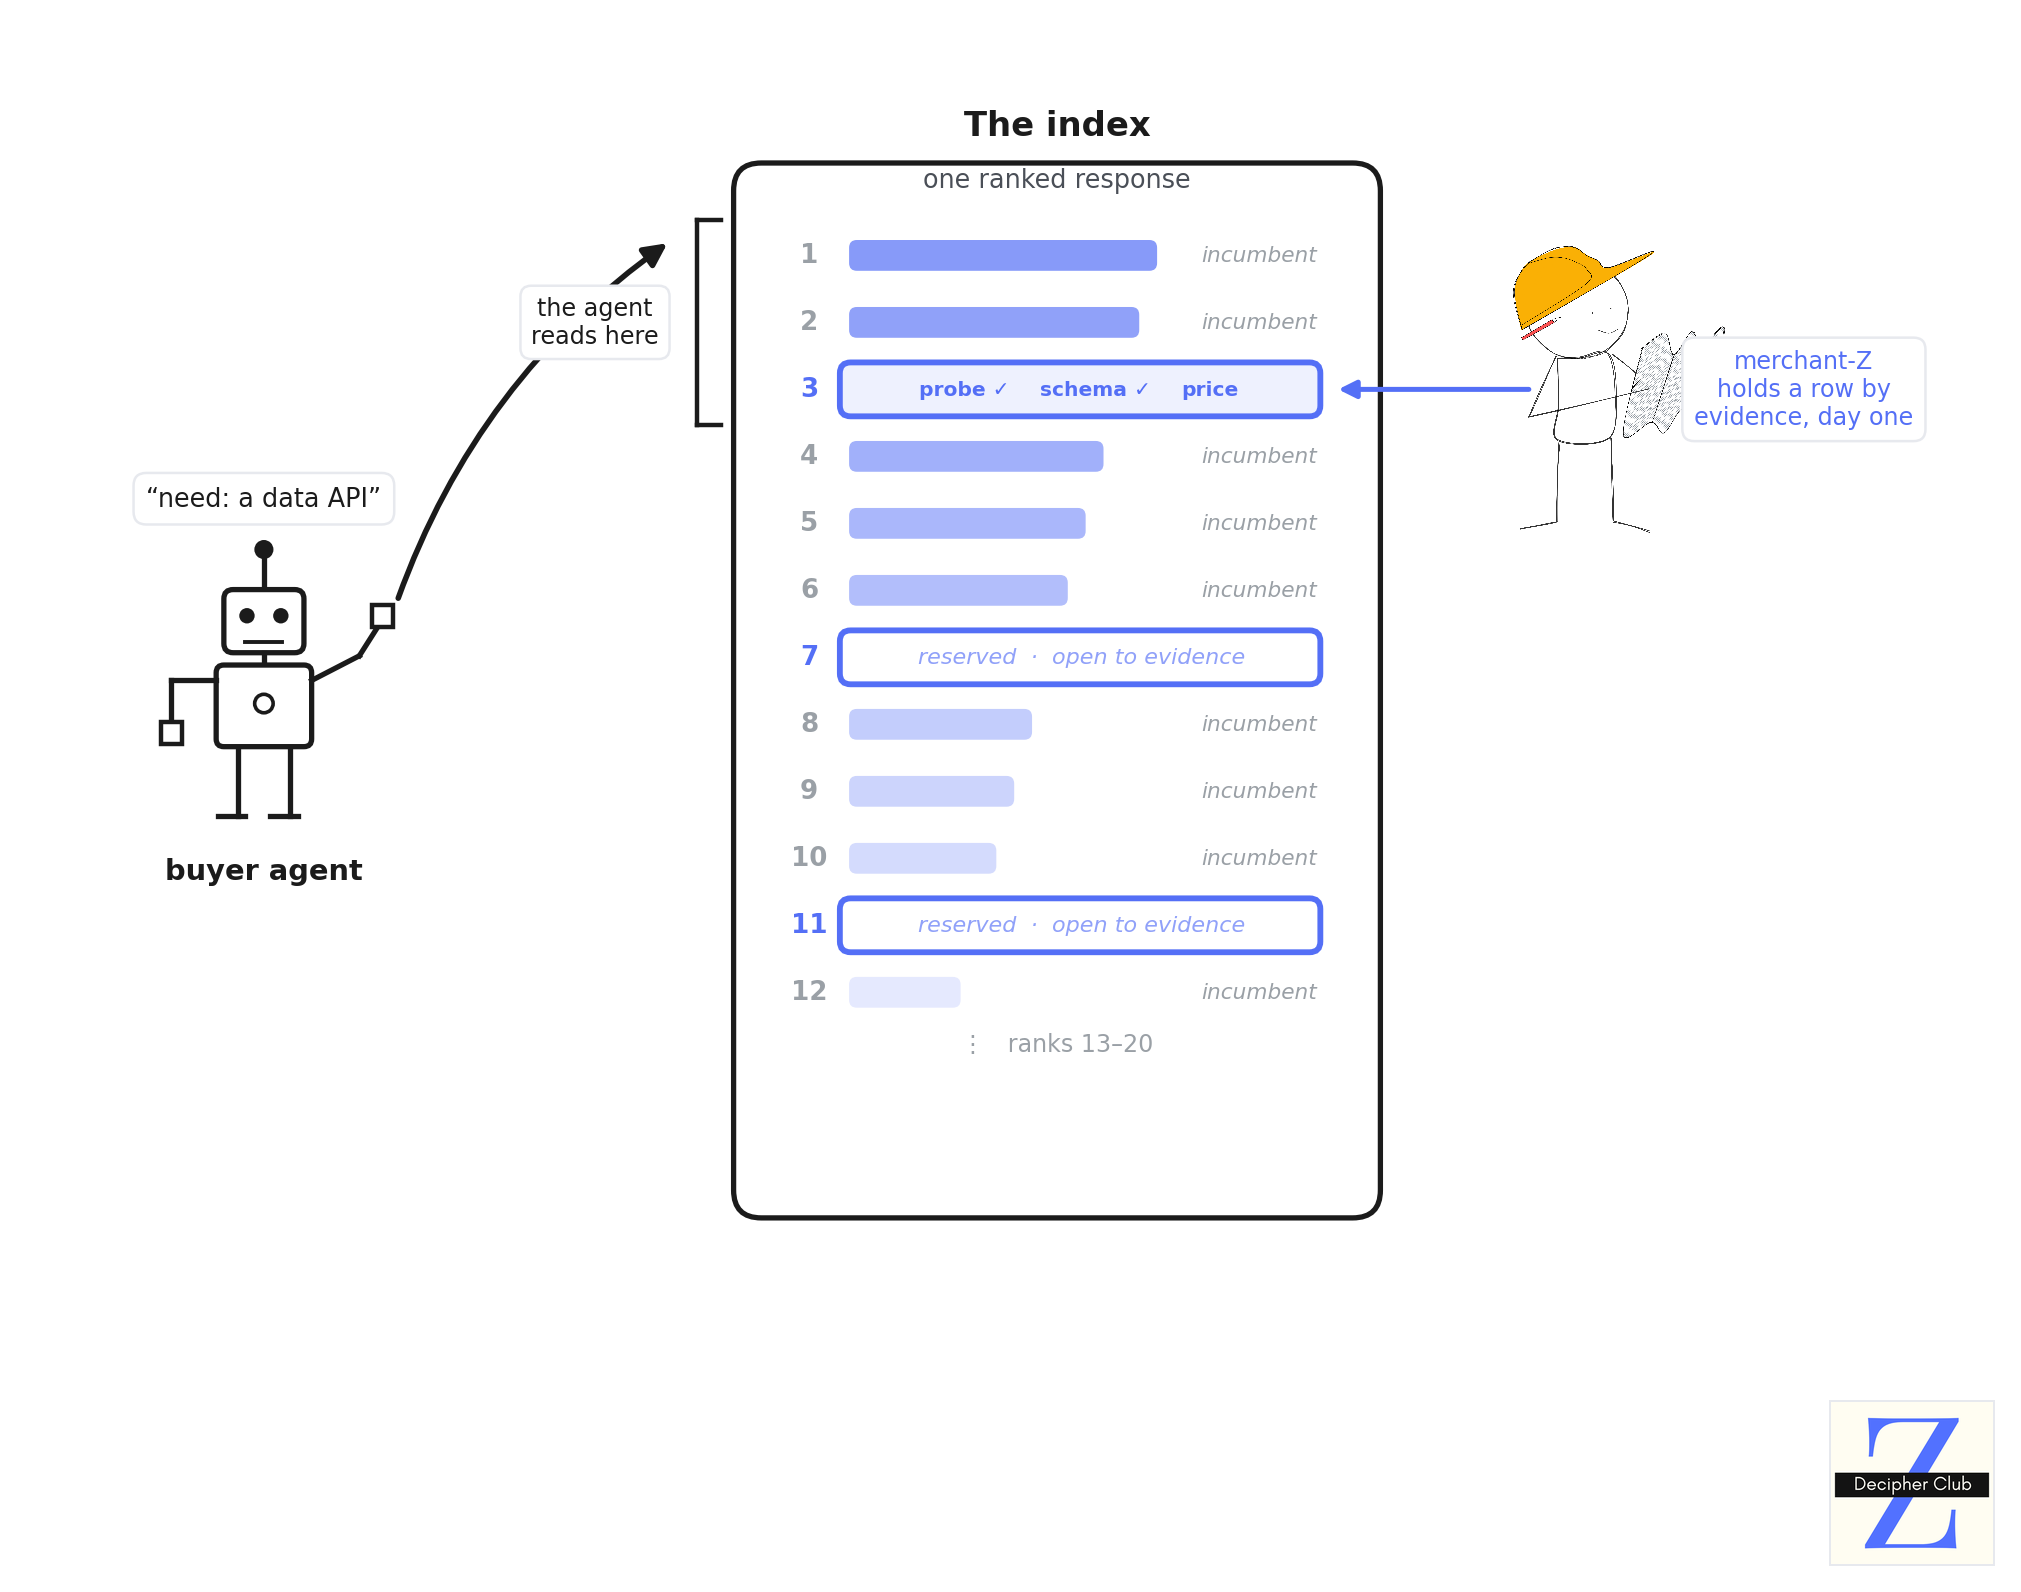
For instance, in a 20-result response, three slots go to new merchants. The other seventeen stay volume-ranked exactly as they are today. Three is an example, not a rule. The right share is a tuning choice for each index.
How does ranking work in Reserved Slots?
Inside the reserved slots, sales history plays no part. Merchants are ranked on evidence of merchant services — the things a merchant can prove about its service today. One workable scoring formula:
SlotScore = 0.40·reliability + 0.25·intentMatch + 0.20·listingQuality + 0.15·priceValue
Each term is measurable on a merchant's first day:
- Reliability is the probe-measured health of the service — uptime, latency, schema conformance — bought from the providers named in Section 5.2.1, normalised to a 0–1 score.
- Intent match is how closely the listing matches what the agent actually asked for. Bazaar and AgentCash already compute this semantic similarity for every query (section 2.2). The slot formula reuses it.
- Listing quality is the same composite this report scored in Section 3.2: schema presence, worked examples, description completeness.
- Price value is the merchant's price measured against its category's going rate. Cheaper than the median scores higher, floored so that a race to zero earns no extra credit.
Where do slot merchants collide with incumbents?
The response stays twenty results long. The reserved slots sit at fixed, published positions — say 3, 7 and 11. The top two incumbents keep their places, and the merchants at ranks 18–20 fall off the page. The cost of the slots is paid by the tail of the list, which section 2.1 shows agents almost never read. That is the same logic Airbnb used when it tuned its new-listing boost to be bookings-neutral.
Real-world reference:
- Airbnb reported a new-listing boost tuned to be bookings-neutral while allocating 8.5% additional first-page impressions to new inventory (Haldar et al., KDD 2020).
- Etsy's EU-mandated ranking disclosure documents a temporary search boost for new listings, plus a per-shop frequency cap within results (Etsy ranking disclosures).
With this approach, a sale won in a reserved slot settles on-chain like any other and becomes the record the leaderboard reads. The slots are a ramp into the main ranking, not a shelter from it.
5.1.2 A Reliable Head-Start for Merchants
New merchants enter the market with no significant metrics to attract an agent's attention.
An obvious method of encouraging new merchants to join and to level the playing field, is to give a temporary boost to merchants for a particular time-period.
The simplest way to build that boost is a calendar window. A new merchant gets help for a fixed period after it lists — its first 30 days, for example. However, a calendar window has two flaws.
- The clock runs whether or not anyone sees the merchant. Merchant Z lists on day one, and no agent queries its category for weeks. The 30 days tick down anyway, and the help lapses while Z was never once shown. The boost was spent on waiting, not on being seen.
- The length of the window has no right answer. Nothing in the market says whether 30, 60 or 90 days is fair. A busy category needs days. A quiet one may need months. Any single number is wrong for most categories.
Proposed Solution
The reserved slots from Section 5.1.1 give a new merchant a head start on ordering, not just admission. That head start has to end. The real question is what it should end on.
The better answer is exposure - the number of times the index has actually shown the merchant in a response.
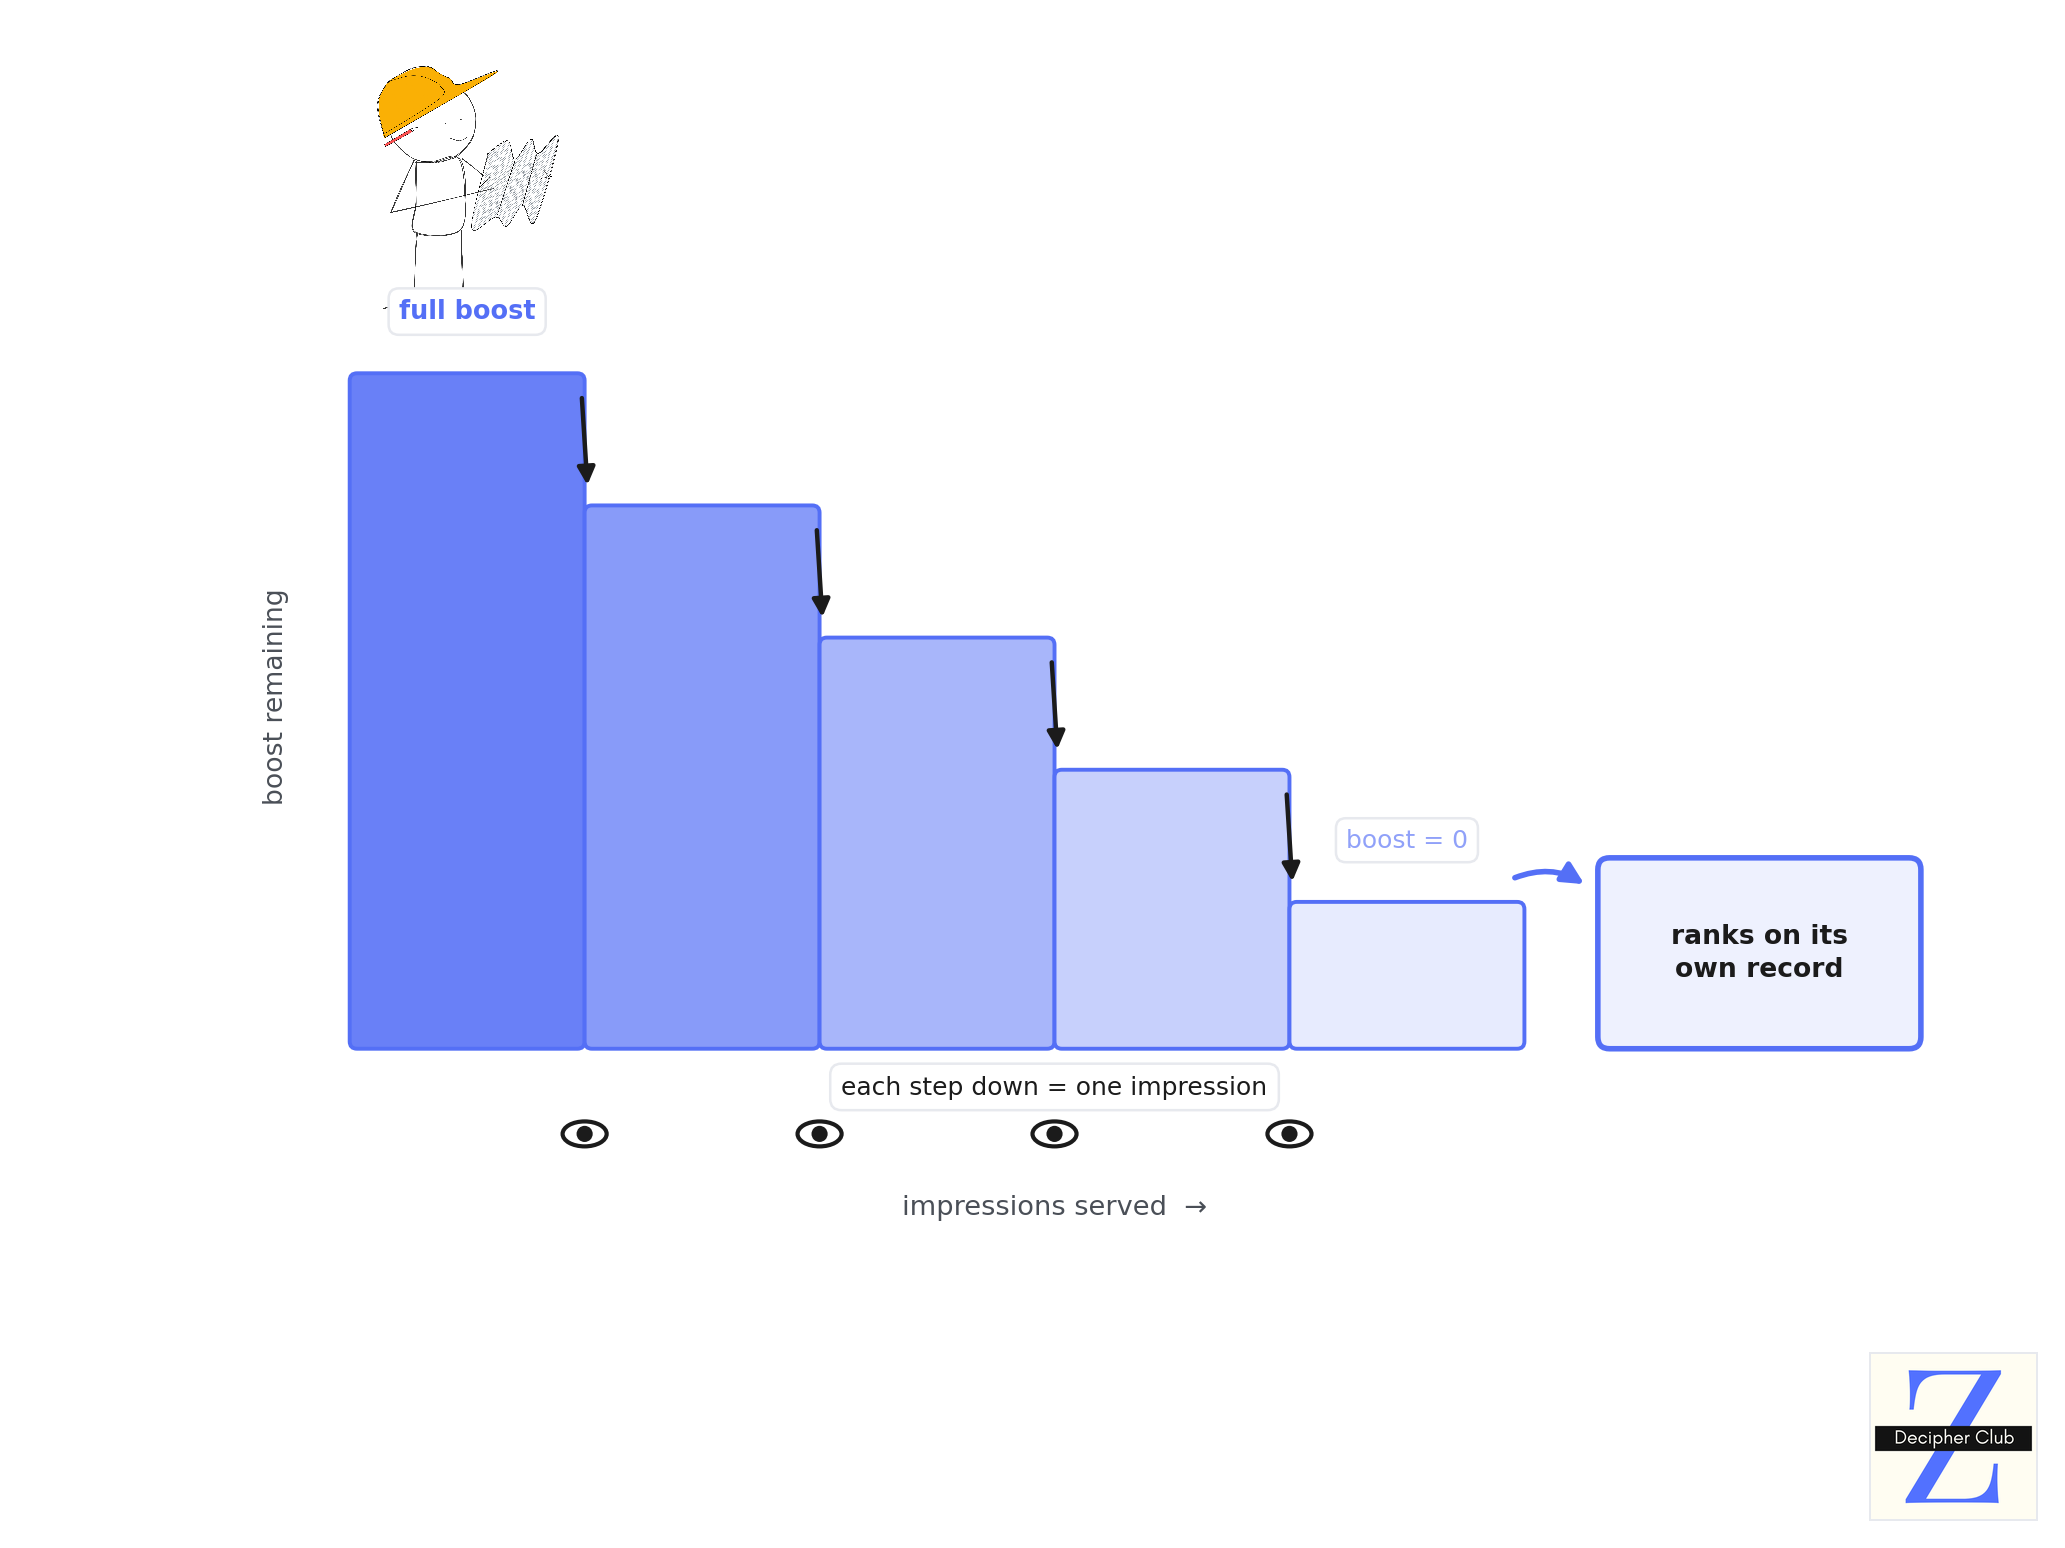
An index boosts a new merchant because it does not yet know how good the merchant is. Every time it shows the merchant, it learns something, because the agent either bought or passed. So the boost shrinks one step per impression, and reaches zero once the merchant has been shown enough times to stand on its own sales record.
Working Mechanics
The index keeps one extra number for each new merchant: an impression counter that starts at zero. It also publishes two constants — the boost a merchant starts with (B₀) and the number of impressions after which that boost reaches zero (N). The boost at any moment is a plain decay of the counter:
boost(i) = B₀ × max(0, 1 − i / N) // i = impressions shown so far; N = graduation limit
That boost is added to the merchant's slot score from Section 5.1.1, and the sum decides its place among the reserved slots:
reservedRank = SlotScore + boost(i)
A fresh merchant, at zero impressions, carries the full boost on top of its evidence score, so it surfaces early in the reserved slots.
- Each time the index shows it, the counter rises by one and the boost drops a step.
- Once the counter reaches N, the boost is zero and the merchant ranks on evidence alone.
- Once its settled sales cross the Section 5.1.1 threshold, it leaves the reserved lane and competes in the main volume-ranked list on its own record.
The flow, step by step. What happens from the moment a new merchant joins:
- Merchant Z lists, posts its bond, and settles its first call. The index admits Z, tags it as new, and sets its impression counter to zero.
- An agent queries a category Z belongs to. The index builds one response: the volume-ranked incumbents, plus the three reserved slots from Section 5.1.1.
- To fill the reserved slots, the index scores each eligible new merchant as
SlotScore + boost(i)and places the top few. Z, being fresh, carries a full boost and lands a slot. - The index logs the impression. Z was shown, so its counter rises by one, and its boost for the next query is one step lower.
- The agent buys from Z or passes. A purchase settles on-chain and joins Z's record; a pass costs Z nothing, but the impression is already counted.
- The cycle repeats. Z's boost decays one impression at a time. When the counter reaches N, Z ranks on evidence alone; when its sales cross the threshold, Z graduates to the main list.
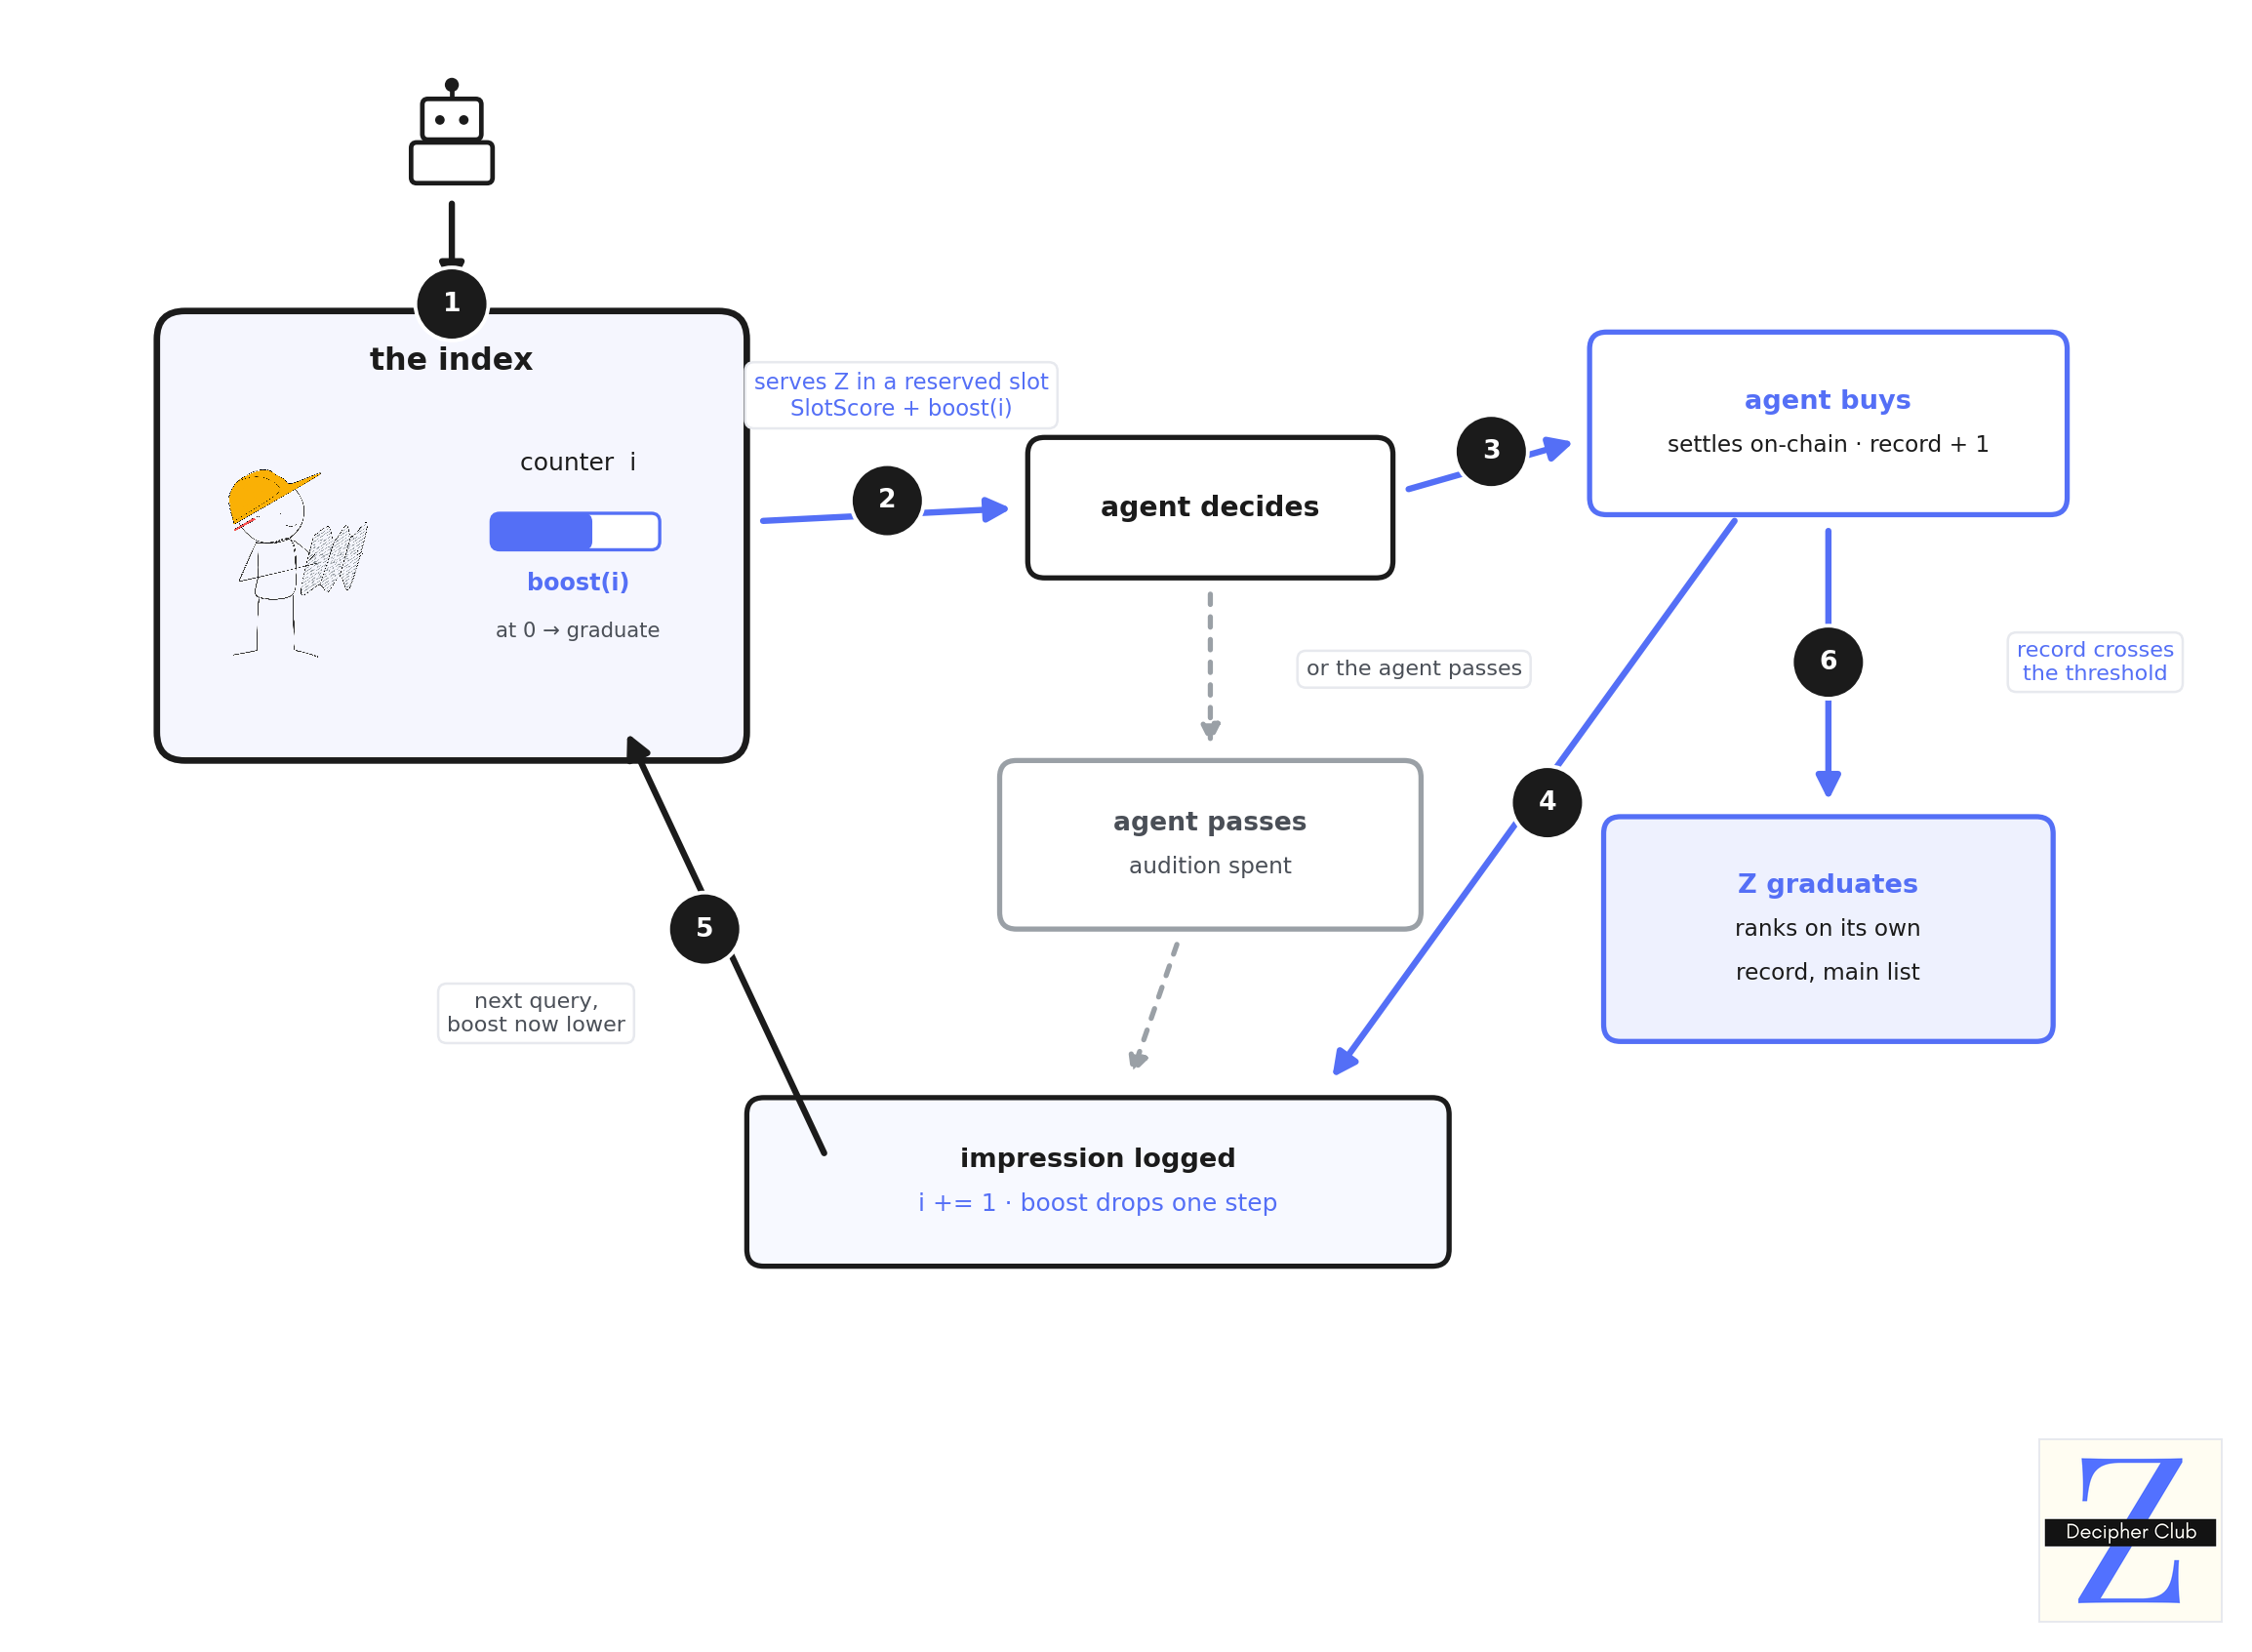
For Merchant Z, this means the head start is spent where it counts. In a busy category, Z is shown often, uses up its boost within days, and is judged on real auditions. In a quiet category, the boost simply waits with Z until agents arrive. Either way, Z's help is spent on being seen, never on a clock Z cannot control.
Decaying the boost on sales instead was considered and rejected. It would pull the help away exactly when Z starts winning, which would rebuild the sales-need-sales trap this fix exists to break.
Real-world reference. This is the standard construction in delivery marketplaces.
- Uber Eats documents that a new restaurant's UCB (upper confidence bound) score starts high and "smoothly decreases" as it gathers impressions (Uber engineering).
- DoorDash documents the same bonus surfacing merchants no consumer had ordered from (DoorDash engineering).
- Storj runs the decentralised version, routing roughly 5% of traffic to unvetted storage nodes until they pass about 100 audits (Storj whitepaper).
5.1.3 Missing History Is Uncertainty, Not a Low Score
What happens today. In the reference model this report uses, sales volume and buyer diversity carry 65% of the weight (Section 3.2). A merchant with no sales scores zero on both. So the formula reads "no data yet" as "no merit." Section 4.3 measured the ceiling this creates: a new merchant with a perfect listing still cannot reach the incumbents' scores.
Proposed Solution
For every merchant, the index keeps an estimate of one thing: the chance that a paid call to this merchant works. It also keeps track of how sure it is about that estimate. A merchant with no history starts at the typical success rate of its category, with low certainty. Every new piece of evidence moves the estimate and raises the certainty.
The rule as a formula. The estimate is a simple ratio of calls that worked to all calls, with a small starting amount added to both:
estimate = (priorWorked + worked) / (priorTotal + total)
// priorWorked, priorTotal : the category starting point, published by the index (e.g. 7 of 10 = 0.70)
// worked, total            : evidence collected so far — test calls (5.2) and buyer outcomes (5.3)
The starting amount is small on purpose. A merchant with no history sits at exactly the category rate, 0.70. Each real data point then counts for a lot. A merchant with a thousand calls of history sits almost exactly at its measured rate, and one more call barely moves it. That difference is the certainty.
How the ranking uses it. The index does not sort merchants by their estimate directly. For each query, it draws one random value from the range each merchant's estimate allows, and sorts by those draws. This method is called Thompson sampling: a way of choosing between options that picks each one in proportion to the chance it is actually the best (Russo et al., A Tutorial on Thompson Sampling). A merchant with a narrow range draws close to its estimate every time. A merchant with a wide range sometimes draws high and lands at the top.
The flow, step by step.
- Merchant Z lists. The index sets Z's estimate to the category starting point, 7 of 10, with low certainty.
- An agent sends a query. The index selects the merchants that match it.
- For each matching merchant, the index draws one value from that merchant's range.
- The index sorts by the draws and returns the list.
- Incumbents with long histories draw close to their estimates. Z's draws spread widely, so on some queries Z draws highest and appears first.
- Each test call (5.2) and each buyer outcome (5.3) updates Z's estimate and narrows its range.
- If Z is shown many times and never chosen, its estimate is pulled down toward that result. This ends the benefit, as constraint C5 requires.
The index publishes the category starting point and the rules in step 7. Their exact values are implementation choices and are deliberately left unset here.
A worked example. The numbers below are illustrative, not audit data. Merchant Z enters a category with two incumbents, A and B.
| Merchant | History | Estimate | Certainty |
|---|---|---|---|
| A | 960 calls worked, 40 failed | (7 + 960) / (10 + 1,000) = 0.957 | High — range about ±0.006 |
| B | 850 calls worked, 150 failed | (7 + 850) / (10 + 1,000) = 0.849 | High — range about ±0.011 |
| Z | None | 7 / 10 = 0.70 | Low — range about ±0.14 |
Against B, Z draws the higher value on about one query in seven. Against A, Z draws higher on only about one query in 180. That difference is intended. B is a merchant the index has reason to doubt, so Z gets real chances to show it is better. A is close to perfect, so Z rarely displaces it. Under today's formula, Z would win neither comparison on any query.
Real-world reference.
- Etsy states that "New shops and listings have a neutral quality score, which has no impact on placement" (Etsy Help). A new listing starts at neutral, not at zero.
- EigenTrust, a reputation system for peer-to-peer file sharing, gives peers with zero trust "a fixed 10% chance" of being picked, so that new peers can build a reputation (Kamvar et al., EigenTrust).
5.2 Outcome-Based Discovery: Feeding Results Back into Ranking
As of today, every index reads a sale the same way, whether the service worked or not. A paid call that returns an error or a wrong answer still adds one to the merchant's call count, one to its buyer count if the buyer is new, and its price to its volume. Its rank goes up either way. The discovery loop records that a purchase happened. It does not record whether the purchase worked.
Feedback systems exist, but they are not tied to payment.
ERC-8004, the draft standard for agent identity and reputation on Ethereum, lets any address post feedback about an agent, except the agent's own owner (EIP-8004). The specification itself states that "Sybil attacks are possible, inflating the reputation of fake agents." Its feedback format includes a proof-of-payment field, but the field is listed among optional fields and is not enforced.
Proposed solution is to tie every piece of feedback to one real paid call, let only the buyer who paid write it, and feed it into the estimate that orders the next agent's results.
This takes four parts:
- a receipt for each paid call (5.2.1),
- one outcome per receipt (5.2.2),
- outcomes that move the rank (5.2.3),
- and a check that the buyers are real (5.2.4).
5.2.1 A Receipt for Every Paid Call
The rule in words. When a paid call settles, the facilitator signs a short record of it — a receipt. A facilitator is the service that verifies and settles x402 payments on a merchant's behalf, such as Coinbase's CDP facilitator. At settlement it already sees who paid, who was paid, how much, and for which service. Signing a receipt adds one signature to work it already does.
The rule as a data structure.
| Field | Meaning |
|---|---|
| issuer | The facilitator that signed the receipt |
| payer | The buyer's wallet |
| payee | The merchant's wallet |
| service | A fingerprint of the endpoint and its declared schema |
| category | The service category |
| amount, asset, chain | What was paid, in which token, on which chain |
| settlementRef | The on-chain transaction that settled the payment |
| issuedAt | When the receipt was signed |
One paid call produces exactly one receipt. Any facilitator, or a merchant server that settles its own payments, could sign receipts with its own key. Each index decides which issuers it trusts, and publishes that list.
Making receipts work the same way across facilitators would need a small new standard. This report describes what such a standard would need to carry. It does not propose the standard's text.
5.2.2 One Outcome per Receipt
The rule in words. The buyer who paid for a call can attach one outcome to its receipt: whether the call worked, was degraded, or failed. "Degraded" covers a call that returned something usable but slow, partial or late. Only the payer named on the receipt can write the outcome. Each receipt accepts one outcome, and later writes are rejected.
The rule as a data structure.
| Field | Meaning |
|---|---|
| receiptRef | Which receipt this outcome belongs to |
| outcome | worked, degraded or failed |
| latency | How long the call took, as the buyer saw it (optional) |
| signature | Signed by the payer named on the receipt |
How an outcome is accepted. The index, or any scorer, accepts an outcome only if all three checks pass:
- The receipt's signature matches an issuer on the trusted list.
- The outcome is signed by the payer named on the receipt.
- The receipt's settlement reference points to a real on-chain payment from that payer to that merchant.
The third check is the one ERC-8004's optional proof-of-payment field never enforced.
What this does to the cost of faking feedback. Today, writing fake feedback on ERC-8004 costs only a transaction fee. Under this rule, each fake "worked" outcome costs one real paid call to the merchant being praised. Each fake "failed" outcome costs one real paid call to the rival being attacked, so the attacker pays the rival for every attack.
Real-world reference. Airbnb ties reviews to a completed stay. On the day of checkout "both the guest and their host will be prompted to leave a review," and both "have 14 days after checkout" to submit it. A reservation cancelled before check-in cannot be reviewed (Airbnb Help Center). The rule is the same one proposed here: no transaction, no review.
Open question. This group depends on buying agents writing outcomes. Whether they will, and what would make them do so, is left open here for comment.
5.2.3 Outcomes Move the Rank
The rule in words. Each accepted outcome updates the same estimate described in Section 5.1.3. Outcomes count for more than health checks, because they come from a real buyer on a real call. Old outcomes fade, so a merchant's rank reflects how it performs now, not how it performed a year ago.
The rule as a formula.
worked outcome   → adds 1 to "worked"
failed outcome   → adds 1 to "failed"
degraded outcome → adds 0.5 to each
fading           → each outcome's weight halves every 30 days
The 30-day half-life matches the 30-day window indexes already use; CDP reports call count and unique payers "over the last 30 days" (CDP Bazaar). The exact weights and the half-life are implementation choices and are left unset here.
The flow, step by step.
- An agent sends a query. The index returns merchants ordered by their draws, as in Section 5.1.3.
- The agent pays Merchant Z. The facilitator settles the payment and signs a receipt.
- Z delivers the response.
- The agent attaches an outcome to the receipt: worked, degraded or failed.
- The scorer checks the outcome against the three acceptance checks in Section 5.2.2.
- The scorer updates Z's estimate.
- The next agent's query reads Z's updated estimate.
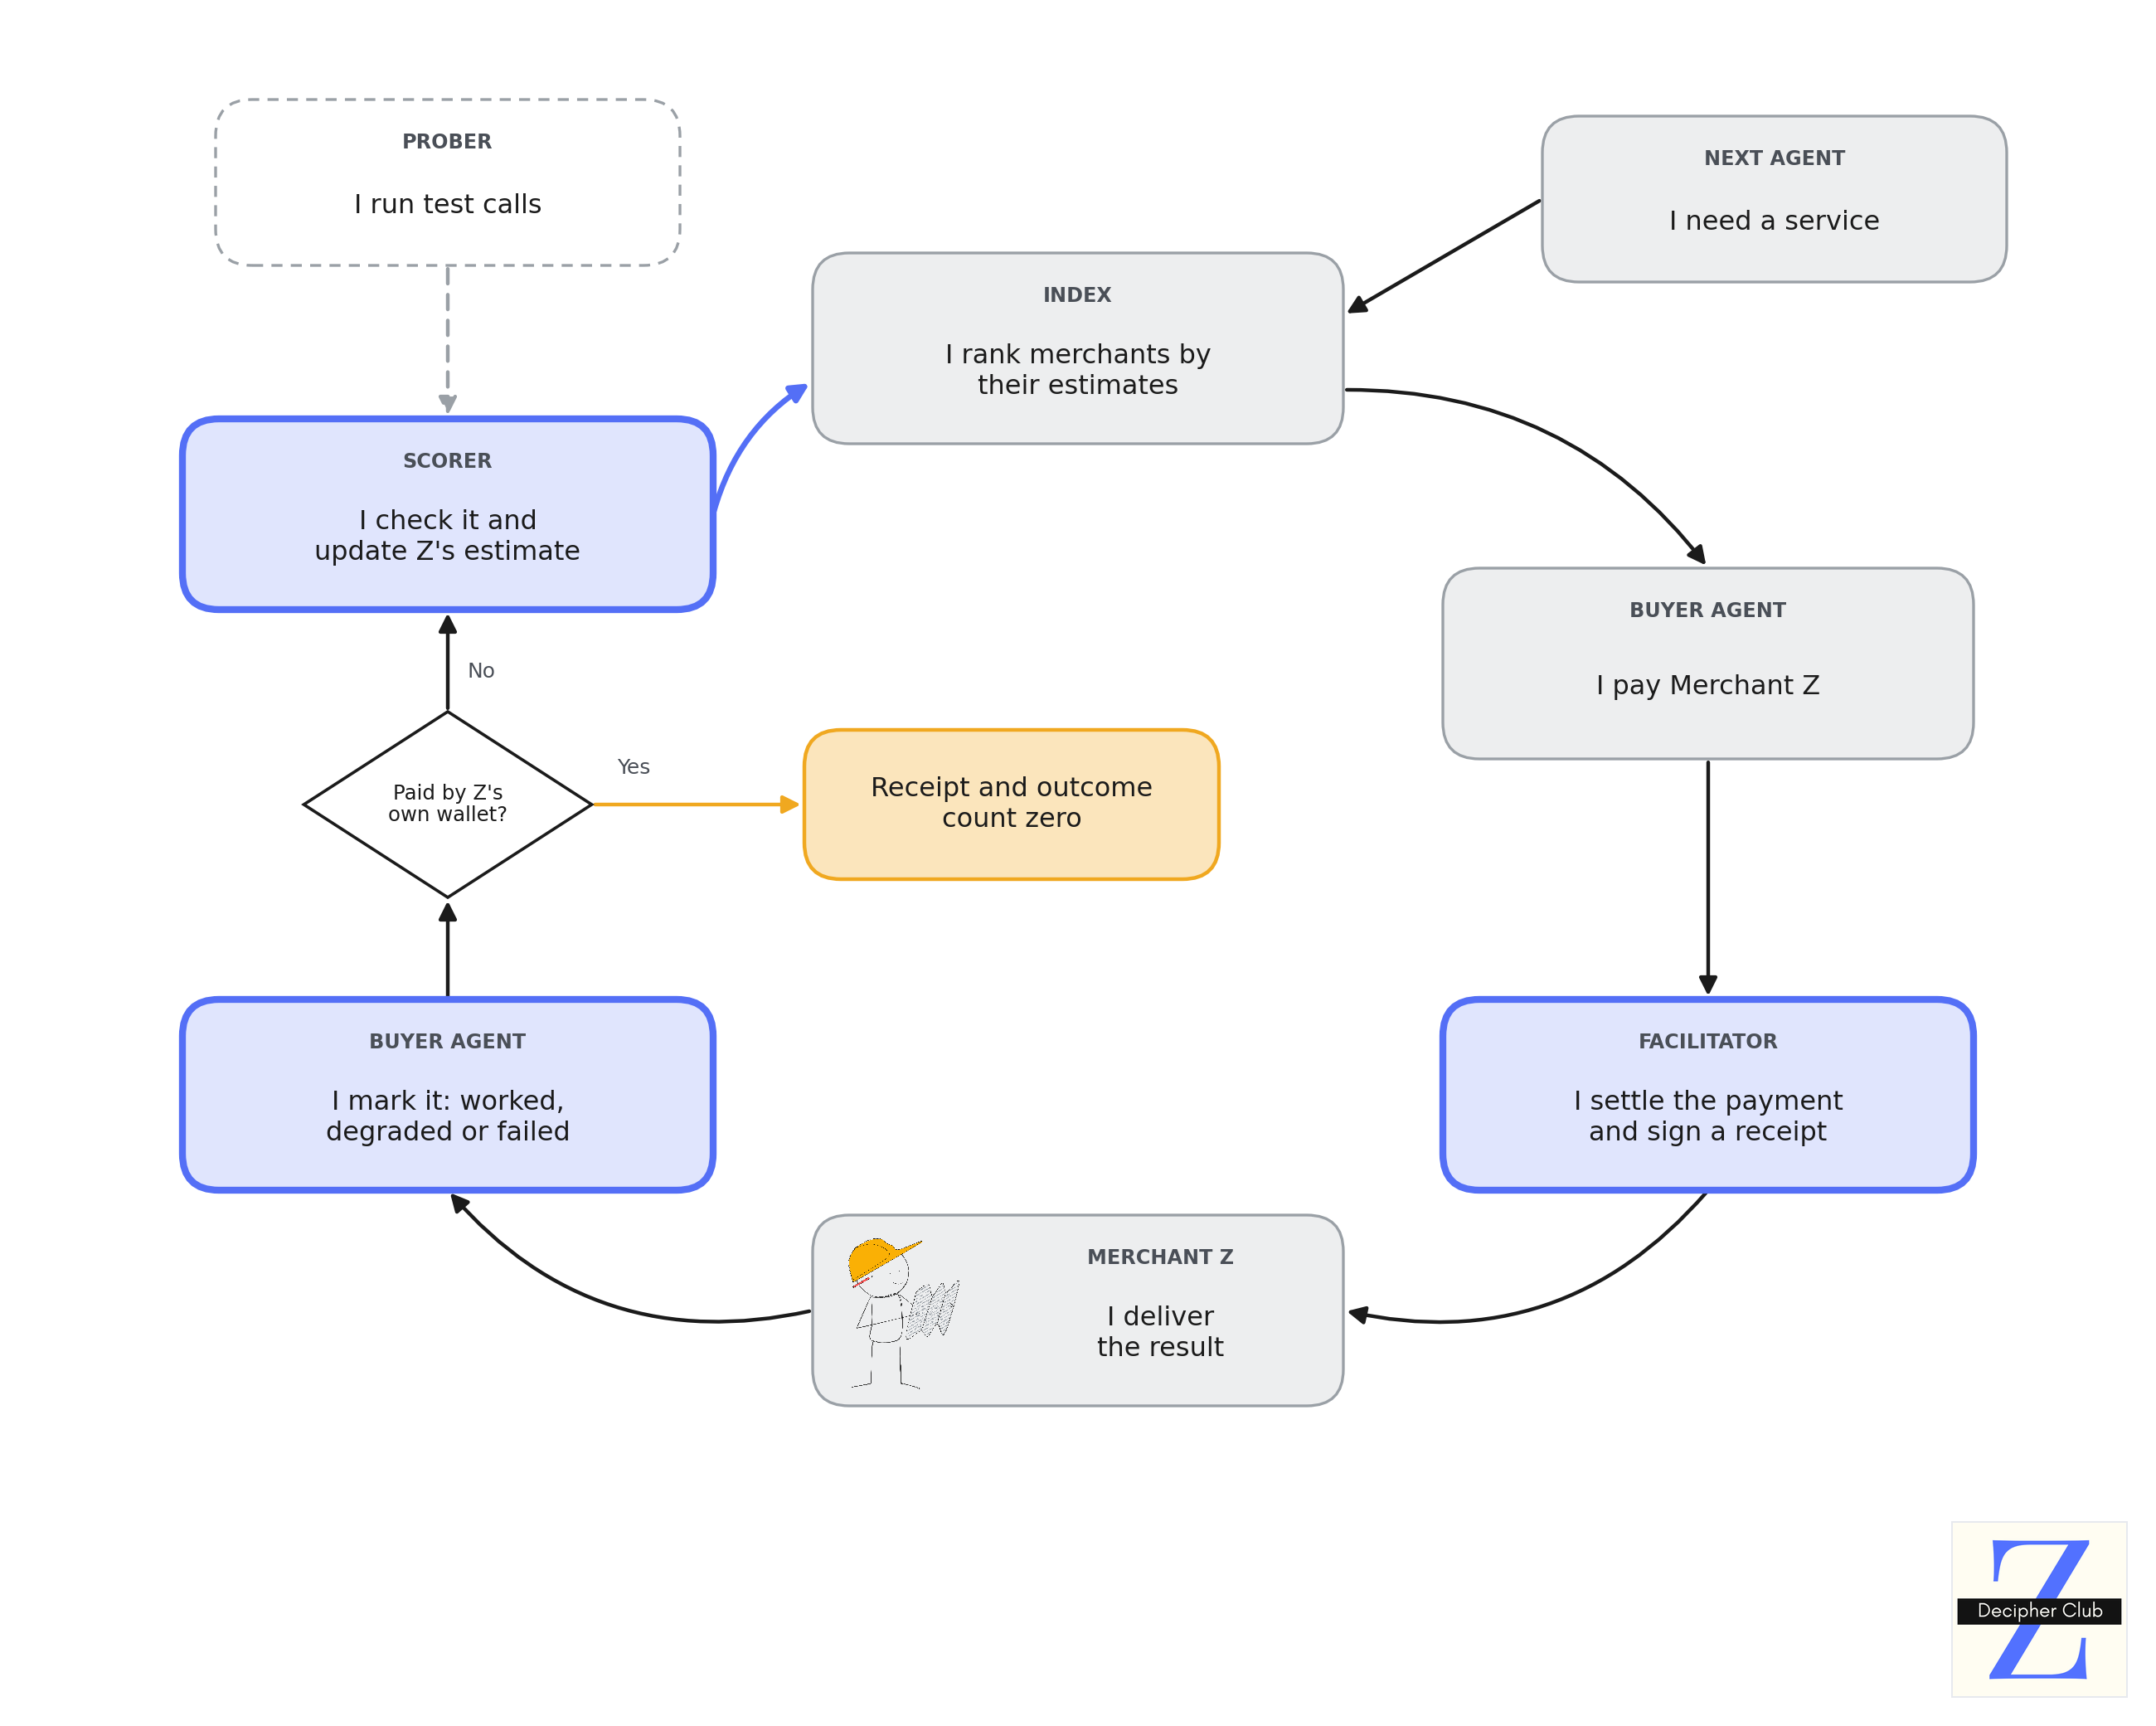
A worked example. Continuing with the merchants from Section 5.1.3:
- Z earns its place. Z starts at the category starting point, 0.70. Over its first 50 sales to independent buyers, 46 are marked worked and 4 failed. Its estimate becomes (7 + 46) / (10 + 50) = 0.88, and its range narrows to about ±0.04. Z now competes with incumbents on its results, not on its record.
- Bad deliveries cost a new merchant more. Suppose instead that Z's first ten outcomes are all failures. Its estimate falls from 0.70 to 7 / 20 = 0.35. The same ten failures move incumbent A only from 0.957 to 0.948, because A has a thousand calls of history to absorb them. A new merchant's estimate moves quickly in both directions. That is intended: the index knows little about it, so each outcome tells it a lot.
- An incumbent cannot coast. Because outcomes fade, an incumbent that stops performing loses the cushion of its old results within a few months.
How this helps, and where it does not. For the first time, rank depends on whether the service worked, and a bad delivery lowers rank instead of raising it. However, outcomes need sales. In a category with almost no demand, outcomes stay rare, and the estimate rests mostly on the health checks in Section 5.3.
5.2.4 Independent Buyers and Repeat Buyers
A settled call through CDP's facilitator costs little. "The first 1,000 onchain Facilitator transactions each month are free, then each additional onchain transaction costs $0.001" (CDP Facilitator). So one dollar buys a merchant a thousand sales from itself. Section 6.2 records independent estimates that most x402 volume is not real demand. Buyer diversity does not stop this: one operator can fund fifty wallets and have each of them pay.
Receipts alone do not fix this. A merchant paying itself still gets a valid receipt, and can still write a "worked" outcome on it.
Proposed Solution
The rule in words. Before counting a receipt, the scorer checks whether the merchant's own wallet funded the buyer's wallet. If it did, the receipt counts for nothing, and so does its outcome. The merchant is not banned or penalised. Its self-funded sales simply stop counting.
The rule as a check.
- Take the payer's wallet from the receipt.
- Look back over a fixed period — for example, 90 days.
- Check whether the merchant's wallet sent funds to the payer's wallet, directly or through one intermediate wallet.
- If yes, give the receipt and its outcome a weight of zero.
- If no, count them normally.
Then one more signal becomes useful. Repeat buyers are independent payers who come back and pay the same merchant again — for example, two or more receipts within 30 days. A buyer that returns has shown the service worked without writing anything. The repeat-buyer rate counts only buyers that pass the funding check above.
How this helps, and where it does not. Self-funded sales become wasted fees instead of free rank. Repeat buyers add outcome evidence that does not depend on agents writing feedback. However, an operator can route funding through an exchange, which a funding check cannot follow. Honest buyers funded through a shared exchange or payment sponsor may also be flagged by mistake. How often that happens has not been measured here.
5.2.5 Where the Evidence Could Live
One workable design keeps receipts and outcomes off-chain and records only a fingerprint of each one on-chain, for example as an entry in the ERC-8004 reputation registry. That way nothing in the buying flow waits for a block, and anyone can still check that a receipt or outcome has not been changed. This is one option among several. Other storage designs could work, and this report does not propose a fixed one.
5.3 Capability-First Ranking: Rank on Proof, Not Past Sales
Section 5.2 ranks merchants on whether their sales worked, which needs sales. This section adds proof — evidence a merchant can show before its first sale: whether its service is up.
5.3.1 Measuring Service Reliability
Today, only CDP Bazaar's hand-curated partner tier is ranked on reliability: 99% availability and regular health probes. Every other listing, including every new merchant, is checked only for reachability and a 402 response (CDP: Get discovered), and x402scan's health data covers only calls through its own relay.
Proposed Solution
The index should measure the reliability of every listed merchant, not only curated partners, and count it as evidence in the estimate from Section 5.1.3.
Reliability here means three measurable things:
- whether the endpoint answers (uptime),
- how fast it answers (latency),
- and whether its payment response follows the x402 format (envelope compliance).
Each scheduled health check is one piece of evidence. It counts for less than a real paid call, because a health check is cheaper and tells the index less.
passed health check  → adds 0.25 to "worked"
failed health check  → adds 0.5 to "failed"
A failure counts more than a pass on purpose. A passed check shows the endpoint was up at one moment. A failed check shows that a buyer calling at that moment would have been turned away. The exact weights are implementation choices and are left unset here.
The flow, step by step.
- A prober calls the merchant's endpoint on a fixed schedule, from several regions.
- For each call, it records whether the endpoint answered, how long it took, and whether the 402 response was well-formed.
- The prober publishes a daily summary for each merchant: checks run, checks passed, typical and slowest response times.
- The index reads the summary and updates the merchant's estimate with the weights above.
- A merchant whose endpoint goes down loses estimate within a day, even if no buyer ever called it.
Fortunately, the data to get reliability score already exists in today's market.
- x402-trust (x402.fuchss.app) probes listed x402 endpoints around the clock — roughly 70,000 at the time of writing, ingesting both the Bazaar catalog and x402scan. It sells a per-endpoint report covering uptime, latency, envelope compliance and price stability, scored 0–100, at $0.005 per query, and it publishes a free leaderboard of the most reliable endpoints.
- x402scout (x402scout.com) runs an MCP discovery server whose paid tools return a live health check for any registered service at $0.001 and a full x402 compliance scan at $0.01 — paid over x402 itself (repository).
5.4 The goal behind every proposal here
None of the proposals above asks an index to favour new merchants. Each asks for something smaller: a fair path from being unknown to being ranked on results. That path has three steps.
- Be seen. A new merchant gets shown before it has a record — through reserved slots, an exposure-based head start, and a ranking that treats missing history as unknown rather than bad (Section 5.1).
- Be judged on proof. Once shown, it is ranked on what it can show today — whether its service is up and fast (Section 5.3).
- Be ranked on outcomes. Once it sells, it is ranked on whether its sales worked, as reported by independent buyers who paid (Section 5.2).
The reason to build this is the cost of not building it. Section 2.5 traced what happens when entry stops paying: rational merchants stop entering, competitive pressure disappears, and quality stops being worth building. The damage leaves no trace in the data. A market that discourages its newcomers does not look broken. It just quietly stops renewing itself.
Every proposal in this section moves discovery in one direction: away from ranking on record — the sales history a merchant has already accumulated — and toward ranking on proof and outcomes. Record rewards whoever arrived first. Proof and outcomes reward whoever runs the best service now.
6. Limitations
This research covers every merchant in the CDP Bazaar catalog as of 9 September 2026, and studies four of its thirteen categories in depth. Its limits are listed below.
- The market is small. The four categories settled $38,735.11 in thirty days, and Crypto & DeFi held 89.5% of it. Data & Enrichment has 91 merchants, so each quartile holds only twenty-two or twenty-three, and seven of the thirteen categories have fewer than thirty merchants. So the analysis compares group averages, not single merchants. No figure here is a forecast.
- Volume is used unadjusted. Independent studies find that most x402 volume is not real demand. Visa and Artemis report about $15.0 million in adjusted volume across 109.6 million transactions, after removing identified wash and test activity. A study of 136.7 million settlements on Base found 21.20% fictitious and a further 63.78% internal to linked clusters. This report keeps the raw figures on purpose, because they are what indexes rank on.
- The ranking formula is a reference model. No index publishes its weights. Every rank, quartile and ceiling here comes from the formula in Section 3.2. All three indexes count volume and buyers, so the direction of the findings should hold. The exact figures would differ under real weights. The audit repository lets any reader re-run the analysis with other weights.
- One snapshot, one catalog. The data covers one 30-day window from one catalog. It does not show whether merchants climbed over time, or how the x402scan and AgentCash catalogs compare. The cold-start ceiling is computed, not observed in any merchant's history.
- Agent choice is assumed, not observed. The data shows what an index returns, not which result each agent bought from. Measuring that needs payment logs matched to search position, which no index publishes.
- The proposals are untested. Section 5 describes designs. None has been run by an index or tested at x402 scale.
Appendix A — Evidence Log
Every figure in this report resolves against a committed artifact in the audit repository, so anyone can reproduce or refute it without contacting the author.
A.1 Artifacts
raw-data.json is the frozen evidence. No script writes to it.
| File | Bytes | What it is |
|---|---|---|
data/raw-data.json |
34,694,123 | Frozen catalog extract, collected 2026-09-09T08:09:16.700Z. 2,252 merchants, 13 categories, 42,201 resources. Fields are uncleaned, unsorted and untrimmed. |
data/analysis-results.json |
81,685 | Concentration measures, quartile decomposition, gap analysis and cold-start ceiling per category. Regenerated by npm run analyze. |
data/recut-results.json |
14,817 | The Section 4.2 raw-field re-cut, emitted under all three aggregation rules. Regenerated by npm run recut. |
data/probes-2026-09-09.json |
39,093 | Live discovery probes from the 2026-09-09 run. The current probe record. |
src/ranker.ts |
9,354 | The scoring implementation, vendored from the production ranker at commit eca0195. Reads the four quality modules below. |
src/taxonomy.ts |
7,497 | Category taxonomy used by the scoring path. Vendored alongside ranker.ts. |
src/description-quality.ts |
7,322 | Description scoring, one input to listing quality. |
src/tag-quality.ts |
4,896 | Tag scoring, one input to listing quality. |
src/service-name-quality.ts |
1,862 | Service-name scoring, one input to listing quality. |
claims.json |
40,527 | Every cited number, with the artifact and derivation path that produces it. |
Cheers Decipherers.
Join the community 👉 Decipher Club Telegram